
Lithogeochemistry of Geological Units of the Mistinibi-Raude Lithotectonic Domain
Supracrustal Rocks
|
Stratigraphic or Lithodemic Unit |
Classification/Rock Type |
Affinity |
Tectonic Setting |
Mg# |
Rare Earth Elements* |
Spider Diagram* |
Comments |
|---|---|---|---|---|---|---|---|
|
Volcanic and Associated Rocks |
|||||||
|
ApPzen (amphibolite; 25 samples) |
Basalt, locally andesite/basaltic andesite and trachy-andesite (Diagram) |
Tholeiitic to calc-alkaline (Diagram) (Diagram) |
0.26-0.72 |
1.4 < (La/Yb)N < 5.6 1.1 < (La/Sm)N 2.6 1.1 < (Gd/Yb)N < 1.7 1.0 < Eu/Eu* < 1.2 (Diagram) |
Negative anomalies in: Th; Ta; (P) (Diagram) |
Flat REE patterns or slightly enriched in light REE; decoupling of Nb and Ta |
|
| pPnts1 (12 samples) |
Rhyolite/dacite, andesite/basaltic andesite and trachy-andesite (Diagram) |
Tholeiitic to calc-alkaline (Diagram) |
0.23-0.45 |
8.0 < (La/Yb)N 16.8 3.0 < (La/Sm)N < 4.7 1.5 < (Gd/Yb)N < 2.1 0.6 < Eu/Eu* < 1.1 (Diagram) |
Negative anomalies in: Ta-Nb; P; Ti Positive anomalies in: Th (Diagram) |
Steeper REE patterns | |
|
pPnts2 (6 samples) |
Basalt (Diagram) |
Tholeiitic to transitional (Diagram) (Diagram) |
Plate margin basalt and, locally, within-plate basalt (Diagram) Calc-alkaline volcanic arc basalt, island arc tholeiite (Diagram) |
0.42-0.48 |
1.3 < (La/Yb)N < 1.38 1.0 < (La/Sm)N < 1.7 1.2 < (Gd/Yb)N < 1.4 0.9 < Eu/Eu* < 1.0 (Diagram) |
Negative anomalies in: (Th); Ta‑Nb; P (Diagram) |
Flat REE patterns |
Amphibolites identified in the Zeni Complex are basaltic to andesitic in composition, or trachy-andesitic, and their affinity varies from tholeiitic to calc-alkaline. The geochemistry of Zeni amphibolites is too variable to identify a tectonic setting, which could suggest that this unit includes rocks of various origin. Rocks of the Ntshuku Complex consist of a majority of felsic to intermediate metavolcaniclastics (pPnts1), varying in composition from rhyolitic or dacitic to andesitic, or trachy-andesitic, with a lower proportion of amphibolite (pPnts2) of basaltic composition. The geochemistry of Ntshuku amphibolites indicates a tholeiitic to transitional affinity and a volcanic arc tectonic setting.
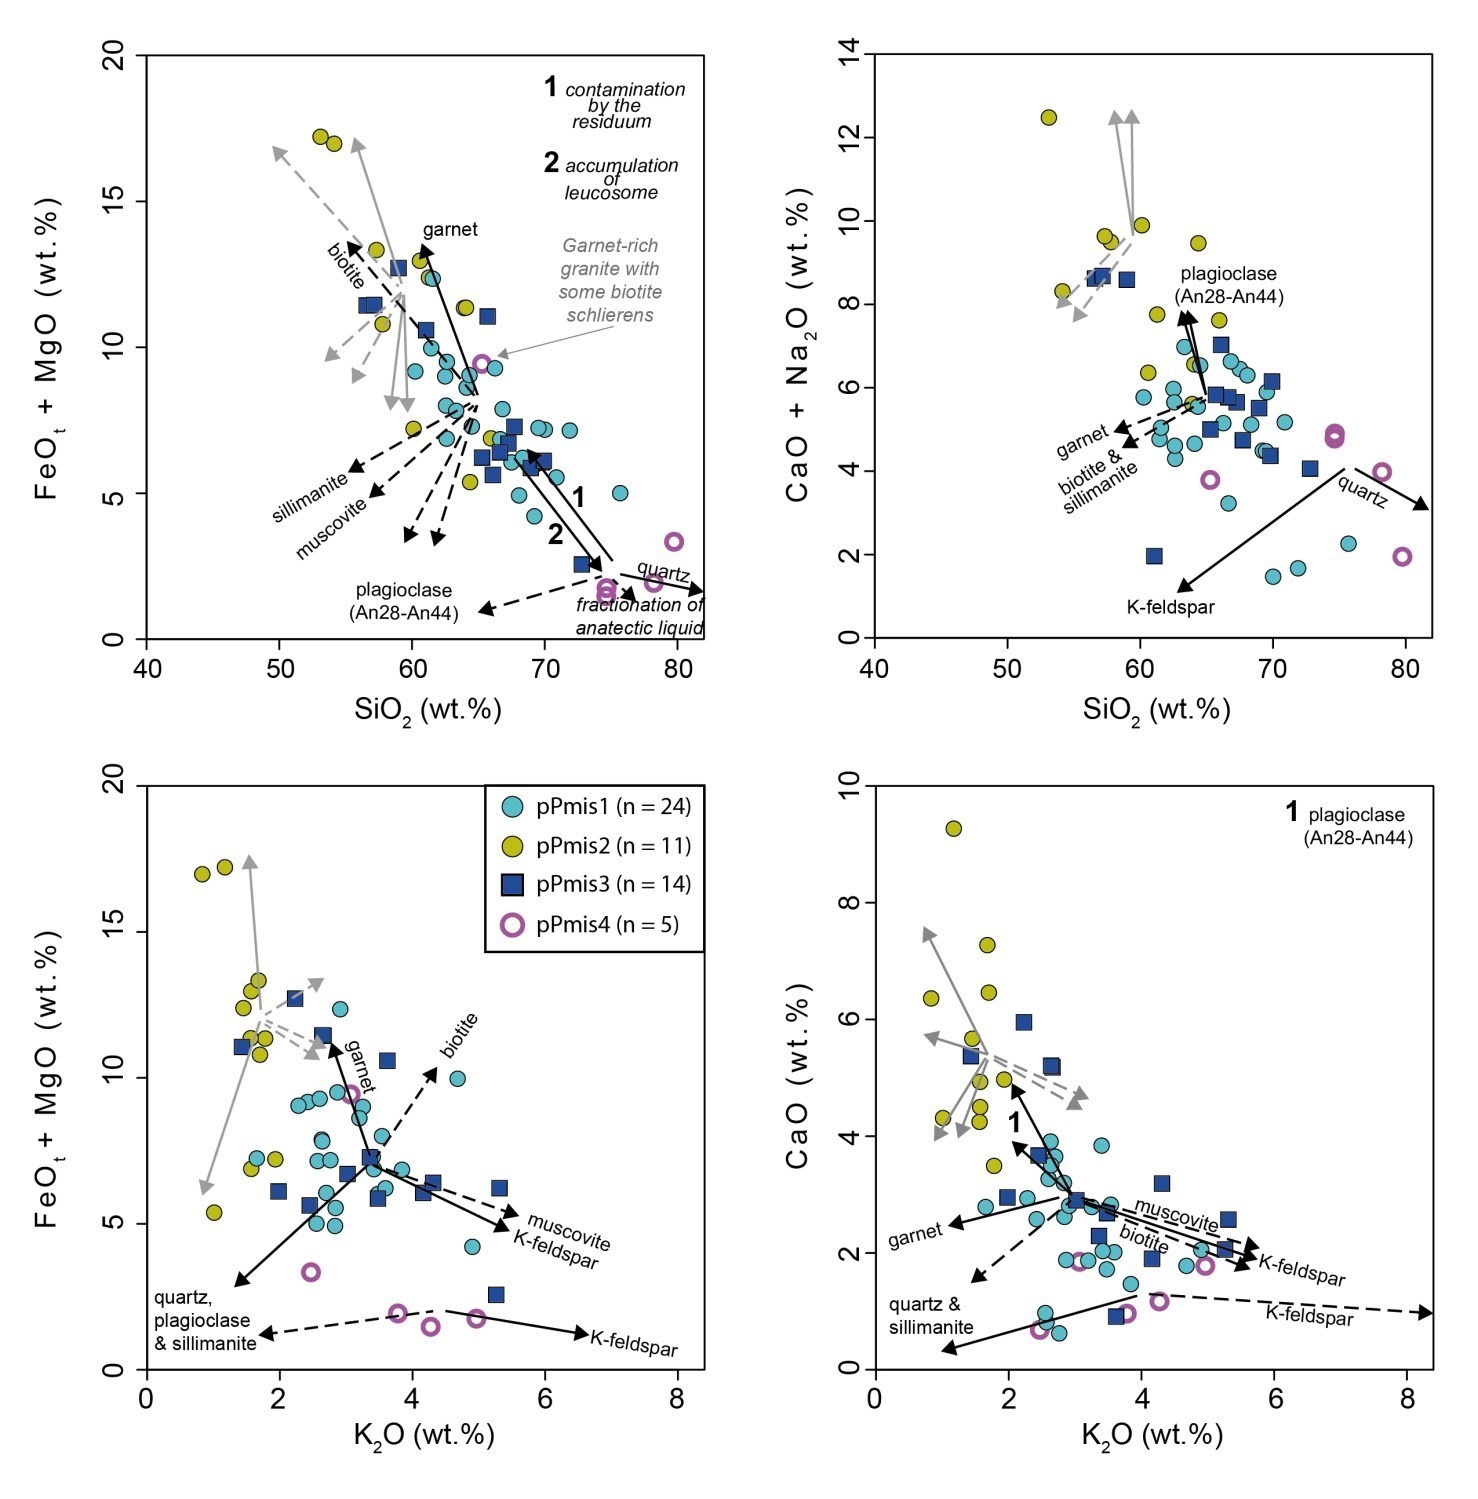
Major oxide diagrams based on Sawyer (2008) illustrate the heterogeneity in the composition of paragneiss and associated diatxites of the Mistinibi Complex. Analyzed samples of unit pPmis1 migmatized potassic paragneiss form a sparse population on the diagrams of Sawyer (2008). However, it is possible to observe spreading towards the pole formed by unit pPmis4 anatectic granite (SiO2 vs. FeOt+MgO diagrma), highlighting the buildup of melt products observed on outcrops for some of the samples. Analyzed samples of unit pPmis2 migmatized paragneiss and calcic gneiss display spreading along the axis of the compositional vector for garnet, which is particularly well discerned on the K2O vs. FeOt+MgO diagram. These samples also spread towards the quartz, plagioclase and sillimanite poles, although these trends are more difficult to distinguish and sometimes even confused with each other. Analyzed samples of unit pPmis3 diatexite display spreading along the axis of the garnet’s compositional vector and towards the pole formed by unit pPmis4 anatectic granite. Samples of this unit that align with axis of muscovite and K-feldspar’s compositional vectors are those containing K-feldspar phenocrystals. Geochemical variabilities highlighted in the diagrams of Sawyer (2008) can be explained by many processes, including variation in the composition of protoliths, accumulation or extraction of melting products at some sampled sites, and contamination by partial melting residues.
Neoarchean Intrusive Rocks
|
Stratigraphic or Lithodemic Unit |
Classification/Rock Type |
Affinity |
Tectonic Setting |
Mg# |
Rare Earth Elements |
Spider Diagram |
Comments |
|---|---|---|---|---|---|---|---|
|
Felsic and Intermediate Intrusive Rocks |
|||||||
|
nAbrs1 (4 samples) |
Tonalite, quartz diorite and quartz monzodiorite (Diagram) |
0.26-0.52 |
11.3 < (La/Yb)N < 28.1 2.4 < (La/Sm)N < 4.8 2.9 < (Gd/Yb)N < 3.0 1.3 < Eu/Eu* < 1.9 (Diagram) |
Negative anomalies in: Th; Ta-Nb; P (Diagram) |
|||
|
ApPter (6 samples) |
Tonalite and gabbro (Diagram) |
0.42-0.67 |
11.0 < (La/Yb)N < 17.3 3.7 < (La/Sm)N < 4.5 1.7 < (Gd/Yb)N < 2.8 0.7 < Eu/Eu* < 2.0 (Diagram) |
Negative anomalies in: (Th); Ta‑Nb; P; Ti (Diagram) |
|||
|
Mafic and Ultramafic Intrusive Rocks |
|||||||
| nApPnek1 (17 samples) |
Mostly gabbro, monzogabbro and monzodiorite (Diagram) |
0.39-0.68 |
9.5 < (La/Yb)N < 15.4 3.4 < (La/Sm)N < 4.1 1.8 < (Gd/Yb)N < 2.3 0.9 < Eu/Eu* < 1.2 (Diagram) |
Negative anomalies in: Th; Ta-Nb; P; Zr-Hf; Ti (Diagram) |
|||
Samples analyzed in the Terriault Complex (ApPter) include felsic intrusive rocks and mafic enclaves.
For the Nekuashu Suite (nApPnek1), the classification diagram clearly demonstrates its compositional diversity, particularly with regard to microcline distribution. This unit consists of various mafic to intermediate intrusive phases, mainly monzodiorite, leucogabbro, monzogabbro and anorthosite along with, incidentally, quartz monzodiorite, gabbro and monzonite. These intrusive phases are in transitional contact and difficult to distinguish from each other.
Paleoproterozoic Intrusive Rocks
|
Stratigraphic or Lithodemic Unit |
Classification/Rock Type |
Affinity |
Tectonic Setting |
Mg# |
Rare Earth Elements |
Spider Diagram |
Comments |
|---|---|---|---|---|---|---|---|
|
Intrusive Rocks |
|||||||
| pPpal2 (23 samples) |
Gabbro, gabbronorite and diorite (Diagram) |
0.37-0.79 |
1.9 < (La/Yb)N < 5.0 1.5 < (La/Sm)N < 2.2 1.1 < (Gd/Yb)N < 1.7 0.9 < Eu/Eu* < 1.1 (Diagram) |
Negative anomalies in: Ta-Nb; P; Zr-Hf; (Ti) (Diagram) |
|||
| pPpal2a (4 samples) |
Garnet gabbro (Diagram) |
0.45-0.48 |
1.5 < (La/Yb)N < 3.3 1.1 < (La/Sm)N < 1.9 1.3 < (Gd/Yb)N < 1.4 Eu/Eu* ≈ 1.0 (Diagram) |
Negative anomalies in: Th; Ta-Nb; P (Diagram) |
The presence of garnet explains higher heavy REE values than for pPpal2. | ||
| pPpal3 (14 samples) |
Granite, granodiorite and quartz monzonite (Diagram) |
Generally ferroan granitoid, alkaline-calcic to alkaline and metaluminous (Diagrams) |
Mostly volcanic arc granite (Diagram) (Diagram) |
0.12-0.26 |
20.2 < (La/Yb)N < 27.4 4.5 < (La/Sm)N < 5.5 2.4 < (Gd/Yb)N < 3.0 0.6 < Eu/Eu* < 0.8 (Diagram) |
Negative anomalies in: Ta-Nb; P; Ti (Diagram) |
|
| pPrae1 (3 samples) |
Gabbronorite (Diagram) |
0.46-0.68 |
1.4 < (La/Yb)N < 5.6 1.1 < (La/Sm)N < 3.0 1.1 < (Gd/Yb)N < 1.4 0.8 < Eu/Eu* < 0.9 (Diagram) |
Negative anomalies in: (Th); Ta-Nb; P (Diagram) |
|||
|
pPrae2 (9 samples) |
Monzonite, monzogabbro and gabbro/diorite (Diagram) |
0.40-0.51 |
14.5 < (La/Yb)N < 19.4 3.3 < (La/Sm)N < 4.1 2.2 < (Gd/Yb)N < 2.6 0.9 < Eu/Eu* < 1.2 (Diagram) |
Negative anomalies in: Th; Ta-Nb; P; (Zr-Hf); Ti (Diagram) |
Unit pPrae2 differs from unit pPrae1 by a lower Mg#, higher La/Yb ratios and negative anomalies in Th, Zr-Hf and Ti | ||
|
pPrae3 (2 samples) |
Quartz monzonite (Diagram) |
Ferroan, alkaline and metaluminous granitoid (Diagrams) |
Volcanic arc or within-plate granite (Diagram) (Diagram) |
0.21-0.25 |
15.8 < (La/Yb)N < 27.4 3.6 < (La/Sm)N < 6.0 (Gd/Yb)N ≈ 2.4 0.7 < Eu/Eu* < 0.9 (Diagram) |
Negative anomalies in: Th; Ta-Nb; P; Ti (Diagram) |
|
| pPped1 (23 samples) |
Gabbro, gabbronorite, gabbro/diorite (Diagram) |
0.38-0.78 |
2.5 < (La/Yb)N < 6.5 1.7 < (La/Sm)N < 2.9 1.2 < (Gd/Yb)N < 1.7 0.8 < Eu/Eu* < 1.0 (Diagram) |
Negative anomalies in: Th; Ta-Nb; P; Zr-Hf (Diagram) |
|||
| pPped1a (3 samples) |
Tonalite (Diagram) |
0.19-0.41 |
7.2 < (La/Yb)N < 30.8 3.7 < (La/Sm)N < 6.1 1.3 < (Gd/Yb)N < 2.3 0.3 < Eu/Eu* < 0.8 (Diagram) |
Negative anomalies in: Ta-Nb; P; Zr-Hf; Ti Positive anomaly in: (Th) (Diagram) |
|||
| pPcab (10 samples) |
Granodiorite and granite (Diagram) |
Ferroan or magnasian granitoid, generally calc-alkaline and metaluminous to peraluminous (Diagrams) |
Volcanic arc or within-plate granite (Diagram) (Diagram) |
0.25-0.41 |
15.6 < (La/Yb)N < 24.6 2.7 < (La/Sm)N < 4.1 2.3 < (Gd/Yb)N < 3.1 0.6 < Eu/Eu* < 0.7 (Diagram) |
Negative anomalies in: Th; Ta-(Nb); P; (Nd); Ti (Diagram) |
The decoupling of the Ta-Nb anomaly explains the variable tectonic setting; negative Nd anomalies are associated with high Nb contents. |
| pPdea1 (7 samples) |
Granite (mostly monzogranite) (Diagram) |
Ferroan or magnasian granitoid, alkaline-calcic and metaluminous to peraluminous (Diagrams) |
Within plate granite (Diagram) (Diagram) |
0.15-0.35 |
30.5 < (La/Yb)N < 42.0 5.3 < (La/Sm)N < 6.6 2.6 < (Gd/Yb)N < 3.1 Eu/Eu* ≈ 0.6 (Diagram) |
Negative anomalies in: Ta-Nb; P; Ti (Diagram) |
|
| pPdmn (25 samples) |
Granite (mostly syenogranite) (Diagram) |
Granitoid generally ferroan, calc-allaline to alkaline-calcic and metaluminous to peraluminous (Diagrams) |
Syncollision and postcollision granite (Diagram) (Diagram) |
0.16-0.41 |
23.5 < (La/Yb)N < 49.0 5.4 < (La/Sm)N < 7.2 2.0 < (Gd/Yb)N < 4.5 0.4 < Eu/Eu* < 0.6 (Diagram) |
Negative anomalies in: Ta-Nb; P; Ti (Diagram) |
REE and spider diagrams similar to pPdea1, but less enriched; pPdmn1 and pPdmn2 |
Like the Nekuashu Suite, the Pelland (pPped) and Raude (pPrae) suites show some compositional diversity. This geochemical variability can be explained by the fact that these are polyphase intrusions involving several mafic to intermediate intrusive phases, which are subsequently intruded by felsic magmas.
Mesoproterozoic Intrusive Rocks
|
Stratigraphic Unit |
Classification/Rock Type |
Affinity |
Tectonic Setting |
Mg# |
Rare Earth Elements |
Spider Diagram |
Comments |
|---|---|---|---|---|---|---|---|
|
mPram1 (13 samples) |
Granite and alkali granite (Diagram) |
Ferroan granitoid, calc-alkaline to alkaline-calcic and metaluminous (Diagram) |
Within-plate granite, type-A (Diagram) |
0.05-0.24 |
10.0 < (La/Yb)N < 17.3 4.1 < (La/Sm)N < 4.7 1.3 < (Gd/Yb)N < 2.0 0.2 < Eu/Eu* < 0.4 (Diagram) |
Negative anomalies in: Th; Ta; P; Ti Positive anomalies in: Zr-Hf (Diagram) |
Including mPram1a |
|
mPjui1 (10 samples) |
Syenite, locally quartz syenite (Diagram) |
Ferroan granitoid, alkaline to alkaline-calcic and peralkaline (Diagram) |
Within-plate granite, type-A (Diagram) |
0.02-0.19 |
7.0 < (La/Yb)N < 8.8 2.9 < (La/Sm)N < 3.4 1.4 < (Gd/Yb)N < 1.7 0.6 < Eu/Eu* < 1.0 (Diagram) |
Negative anomalies in: Ta-Nb; P; Zr-Hf; Ti Positive anomaly in: Th (Diagram) |
|
| mPmit1 (21 samples); mPmit2 (65 samples) |
Granite and quartz monzonite (Diagram) |
Ferroan granitoid, alkaline-calcic to alkaline and metaluminous to peraluminous (Diagram) |
Within-plate granite, type-A |
0.02-0.22 |
9.5 < (La/Yb)N < 17.2 3.9 < (La/Sm)N < 5.4 1.4 < (Gd/Yb)N < 2.0 0.4 < Eu/Eu* < 0.9 (Diagram) |
Negative anomalies in: Ta-Nb; P; Ti (Diagram) |
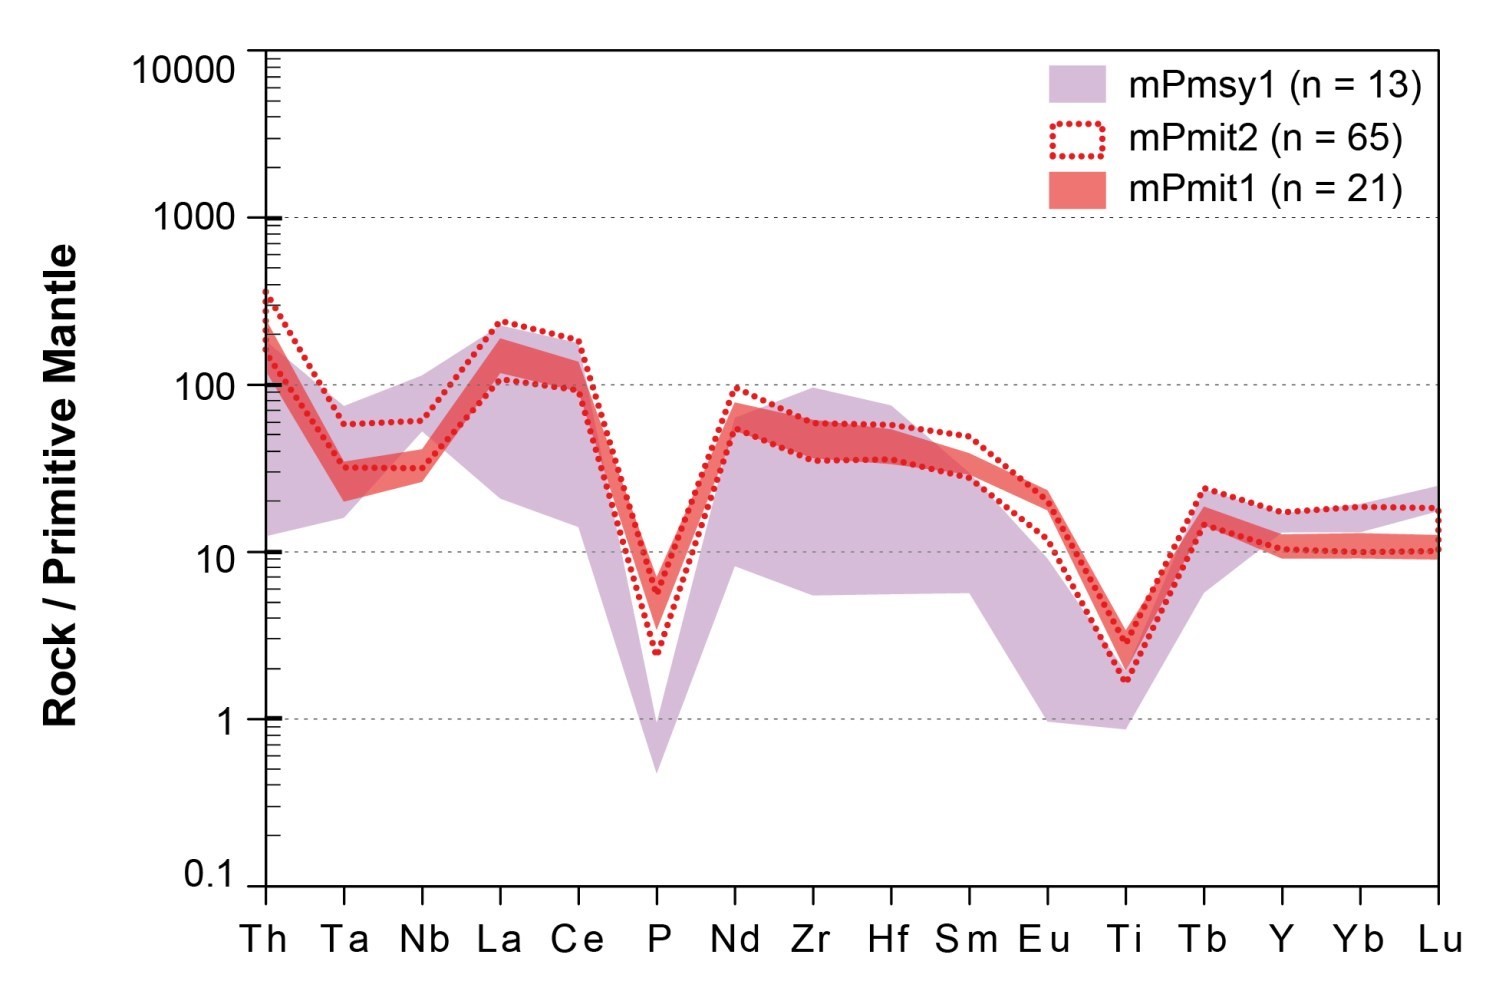
The geochemitry is similar for these two units. |
| mPmsy1 (13 samples) |
Syenite (Diagram) |
Ferroan granitoid, alkaline and metaluminous (Diagram) |
Within-plate granite, type-A (Diagram) |
0.01-0.09 |
1.8 < (La/Yb)N < 9.4 3.5 < (La/Sm)N < 4.8 0.4 < (Gd/Yb)N < 0.9 Eu/Eu* ≈ 0.2 (Diagram) |
Negative anomalies in: Th; Ta-(Nb); P; Ti Positive anomalies in: (Nb); (Zr-Hf) |
REE and spider diagrams are variable; however, a slight enrichment in heavy REE and a significant Eu anomaly are consistently observed. |
| mPbri (10 samples) |
Alkali granite and quartz syenite (Diagram) |
Ferroan granitoid, alkaline and metaluminous (Diagram) |
Within-plate granite (Diagram) |
0.01-0.02 |
The geochemistry of Mistastin Batholith (mPmit) rocks indicates that they are alkaline-calcic to alkaline, A-type, metaluminous to peralumineous granitoids. Their composition is less potassic in the classification diagram of De la Roche et al. (1980) than what is observed in outcrops and stains. This difference in composition could be explained by the fact that these units erode easily and that the largest K-feldspar phencrystals break off when samples are collected, thus being under-represented in the analysis. K-feldspar syenite of the Juillet Syenite (mPjui1) is peralkaline in affinity. Geochemical analyses of the Misery Syenite (mPmsy) indicate a type-A alkaline magma with slight enrichment of heavy rare earth elements. The Lac Brisson Pluton (mPbri) has a variety of granitic facies that are metaluminous and alkaline in affinity.
References
Publications Available Trough SIGÉOM EXAMINE
GODET, A., VANIER, M A., GUILMETTE, C., LABROUSSE, L., CHARETTE, B., LAFRANCE, I. 2018. Chemins PT et style d’exhumation du Complexe de Mistinibi, Province du Churchill Sud-Est, Canada. MERN, UNIVERSITE LAVAL, SORBONNE UNIVERSITE. MB 2018-31, 32 pages.
Other Publications
BARAGAR, W.R.A., 1960. Petrology of basaltic rocks in part of the Labrador Trough. Bulletin of the Geological Society of America; volume 71, pages 1589–1644. doi.org/10.1130/0016-7606(1960)71[1589:POBRIP]2.0.CO;2
DEBON, F. – LEFORT, P. 1983. A chemical-mineralogical classification of common plutonic rocks and associations. Transactions of the Royal Society of Edinburgh, Earth Sciences; volume 73, pages 135-149. doi.org/10.1017/S0263593300010117.
DE LA ROCHE, H. – LETERRIER, J. – GRANDCLAUDE, P. – MARCHAL, M., 1980. A classification of volcanic and plutonic rocks using R1-R2 diagrams and major element analyses – its relationships with current nomenclature. Chemical Geology; volume 29, pages 183–210. doi.org/10.1016/0009-2541(80)90020-0.
FROST, B.R. – BARNES, C.G – COLLINS, W.J. – ARCULUS, R.J. – ELLIS, D.J. – Frost, C.D., 2001. A geochemical classification for granitic rocks. Journal of Petrology; volume 12, number 11, pages 2033–2048. doi.org/10.1093/petrology/42.11.2033.
HARRIS, N.B.W. – PEARCE, J.A. – TINDLE, A.G., 1986. Geochemical characteristics of collision-zone magmatism. In: Collision tectonics (Coward, M.P., and Reis, A.C., editors). Geological Society, London; Special Publications, volume 19, pages 67–81. doi.org/10.1144/GSL.SP.1986.019.01.04.
MANIAR, P.D. – PICCOLI, P.M., 1989. Tectonic discrimination of granitoids. Geological Society of America Bulletin; volume 101, pages 635–643. doi.org/10.1130/0016-7606(1989)101<0635:TDOG>2.3.CO;2.
MCDONOUGH, W.F. – SUN, S.S., 1995. The composition of the Earth. Chemical Geology; volume 120, pages 223-253. doi.org/10.1016/0009-2541(94)00140-4.
PALME, H. – O’NEILL, H.S.C., 2004. Cosmochemical estimates of mantle composition. In: Treatise on Geochemistry (Holland, H.D., and Turrekian, K.K., editors). Elsevier, Amsterdam, The Netherlands; volume 2, pages 1–38. doi.org/10.1016/B978-0-08-095975-7.00201-1.
PEARCE, J.A. – GALE, G.H., 1977. Identification of ore-deposition environment from trace element geochemistry of associated igneous host rocks. Geological Society, London; Special Publications, Volume 7, pages 14–24. doi.org/10.1144/GSL.SP.1977.007.01.03.
PEARCE, J.A. – HARRIS, B.W. – TINDLE, A.G., 1984. Trace element discrimination diagram for tectonic interpretation of granitic rocks. Journal of Petrology; volume 25, pages 956–983. doi.org/10.1093/petrology/25.4.956.
ROSS, P.S. – BÉDARD, J.H., 2009. Magmatic affinity of modern and ancient subalkaline volcanic rocks determined from trace-element discriminant diagrams. Canadian Journal of Earth Science; volume 46, pages 823–839. doi.org/10.1139/E09-054.
Sawyer, E.W., 2008. Atlas of migmatites. Research Press and Mineralogical Association of Canada, 371 pages.
WHALEN, J.B. – CURRIE, K.L. – CHAPPELL, B.W., 1987. A-Type granites: Geochemical characteristics, discrimination and petrogenesis. Contributions to Mineralogy and Petrology; volume 95, pages 407–419.
WINCHESTER, J.A. – FLOYD, P.A., 1977. Geochemical discrimination of different magma series and their differentiation products using immobile elements. Chemical Geology; volume 20, pages 325–343. doi.org/10.1016/0009-2541(77)90057-2.
WOOD, D.A., 1980. The application of a Th–Hf–Ta diagram to problems of tectonomagmatic classification and to establishing the nature of crustal contamination of basaltic lavas of the British Tertiary volcanic province. Earth and Planetary Science Letters; volume 50, pages 11–30. doi.org/10.1016/0012-821X(80)90116-8.