
Lithogeochemistry of Geological Units in the Amos Area
The tables below summarize the lithogeochemical characteristics of geological units in the Amos area. These units are described in the Geological Bulletin covering this territory and in the Quebec Stratigraphic Lexicon. The 233 analyses used here come from samples collected during the Ministère‘s mapping campaign in the summer of 2019. They were selected based on certain criteria, including a sum of major oxides between 98.5% and 101.5% and a loss on ignition (LOI) <3%. These analyses were conducted by the Actlabs laboratory in Ancaster, Ontario.
Analyses were subject to an internal and laboratory quality assurance and control process. Thus, to ensure the accuracy and precision of the values provided by the laboratory, the Bureau de la connaissance géoscientifique du Québec (BCGQ) regularly inserts blanks, standards and duplicates. Reference materials represent ~10% of the analyses.
The majority of samples in the database were analyzed for major oxides, trace elements and metals. Analyses were performed using different techniques depending on elements, such as inductively coupled plasma mass spectrometry (ICP-MS), inductively coupled plasma optical emission spectrometry (ICP-AES) and neutron activation (INAA). For more information on the analysis and dissolution techniques used, refer to the information available for each sample in SIGÉOM à la carte.
The Igpet software was used to produce the geochemical diagrams mentioned in the tables below.
Rare earth elements are normalized to the values given by Sun and McDonough (1989). Anomalous, distinctive or significant grades are shown in bold in the tables.
Supracrustal Rocks
|
Stratigraphic or Lithological Unit |
Classification |
Affinity |
Tectonic Setting |
Mg# |
Rare Earths |
Spider Diagram |
Comments |
|---|---|---|---|---|---|---|---|
|
Volcanic Rocks and Associated Lithologies |
|||||||
|
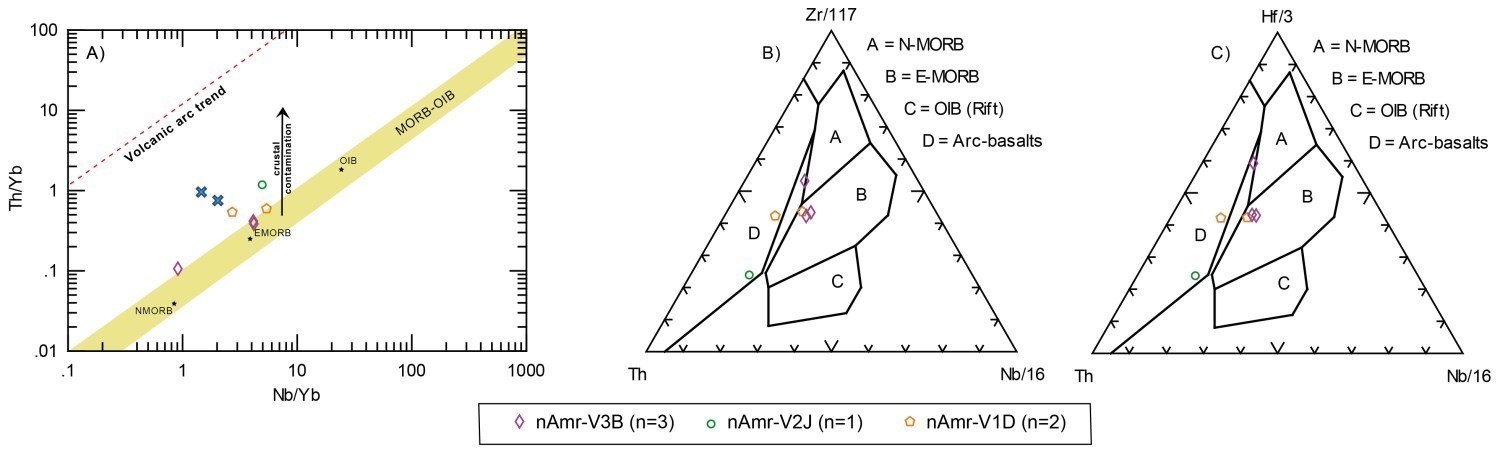
La Morandière Group (nAmr) (3 basalts, 1 andesite, 2 dacites)
|
Subalkaline basalt, andesite and dacite |
Tholeiitic basalt and andesite; Transitional to calc-alkaline dacite |
Volcanic arc basalt Source: E-MORB |
Mean values: basalt = 40.8; andesite = 35.7; dacite = 34.1
|
Basalt: slightly evolved to flat profiles; Andesite and dacite: slightly evolved profile, negative Eu anomaly |
Basalt: negative Sr anomaly, absence of negative Nb-Ta anomaly; Andesite and dacite: negative anomalies in Sr and Ti |
Basalts have a relatively flat rare earth profile. Dacites do not display Eu anomalies. |
|
Landrienne Formation (nAla) Total: 6 basalts, 17 andesites, 8 dacites and 13 rhyolites |
Subalkaline basalt, dacite and rhyolite |
Tholeiitic basalt, andesite, dacite and rhyolite |
Back arc or volcanic arc basalt Source: N-MORB which would have experienced crustal contamination
|
Mean values: basalt = 36.7; andesite = 48.8; dacite = 37.4; rhyolite = 33.3 |
Basalt: flat profile; Dacite and rhyolite: slightly evolved profile, negative Eu anomaly |
Basalt: negative Sr anomaly, absence of negative Nb-Ta anomaly; Dacite and rhyolite: negative anomalies in Sr and Ti
|
Continuous tholeiitic suite from basalt to rhyolite; Combined analyses of Pilote (2018 and 2019) |
|
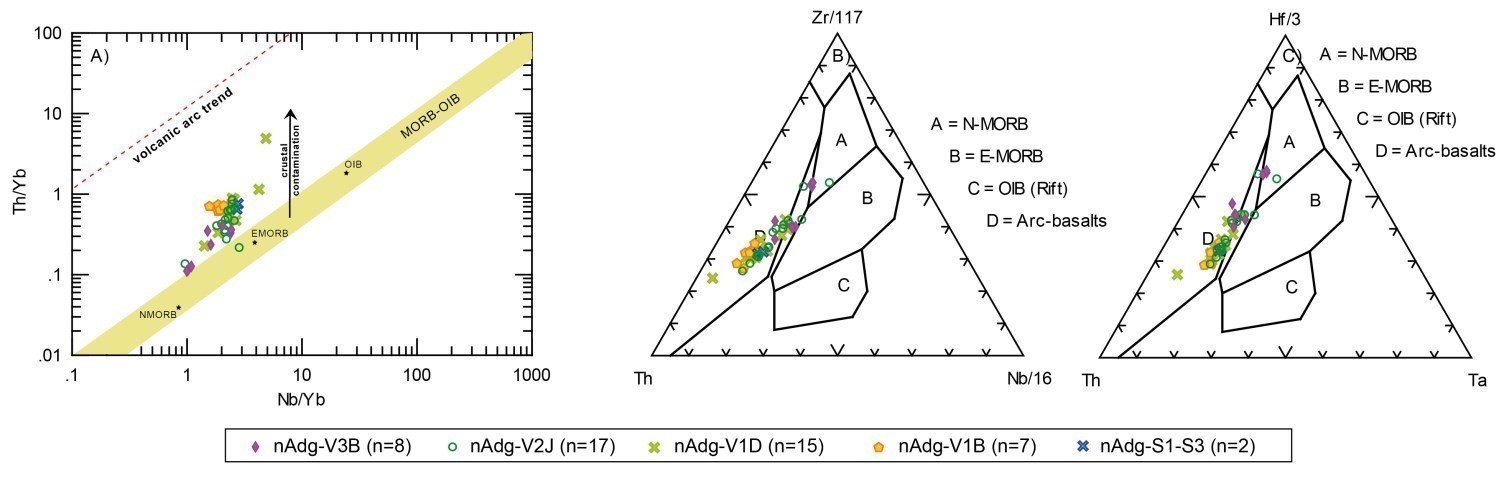
Deguisier Formation (nAdg) |
Subalkaline basalt, andesite, dacite and rhyolite |
Tholeiitic suite |
Source: mainly N-MORB type which would have experienced crustal contamination |
Mean values: basalt = 37.6; andesite = 35.4; dacite = 21.3; rhyolite = 21.8 |
Basalt: slightly evolved profile; Andesite, dacite and rhyolite: negative Eu anomaly |
Basalt to rhyolite: negative anomalies in Sr, K and Ti; Positive Pb anomaly: (strong) |
Rare earth profiles of sedimentary rocks comparable to those of andesite and dacite. |
|
Figuery Group (nAfg) |
Subalkaline basalt, andesite, dacite and rhyolite |
Basalt: tholeiitic and transitional suites; Andesite and dacite: calc-alkaline suite |
Source: N-MORB which would have experienced crustal contamination |
Mean values: basalt = 48.4; andesite = 47.6; dacite = 44.6; rhyolite = 52.4 |
Basalt: 2 types of profiles, flat and evolved; Andesite and dacite: evolved profiles |
Andesite and dacite: negative anomalies in Nb, Ta and Ti |
Rare earth profiles of sedimentary rocks comparable to those of andesite and dacite. |
|
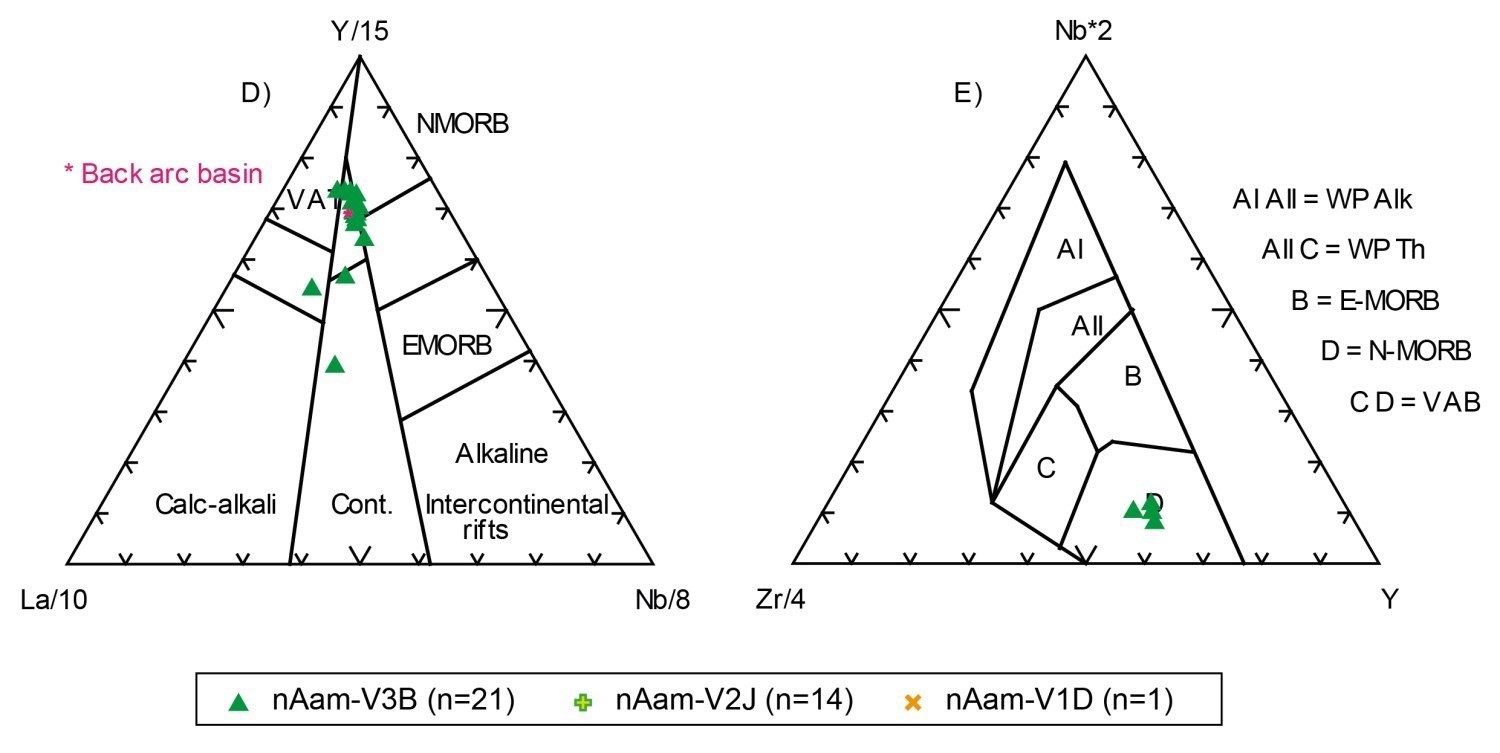
Amos Group (nAam) |
Subalkaline basalt, andesite and dacite |
Basalt, andesite and dacite: tholeiitic suite |
Volcanic arc basalt Source: N-MORB which would have experienced crustal contamination |
Mean values: basalt = 42.8; andesite = 46.6; dacite = 41.6; rhyolite = 34.1 |
Basalt and andesite: flat profiles; Dacite: slightly evolved profiles with slight negative Eu anomaly |
Basalt and andesite: absence of negative Ti anomaly; Dacite: negative Ti anomaly |
Basalt and andesite: comparable and very homogeneous rare earth profiles |
|
Lac Arthur Group (nAur) |
Subalkaline andesite and dacite |
Andesite and dacite: transitional suite |
E-MORB-type volcanism which would have experienced crustal contamination |
Mean values: andesite = 47.5; dacite = 46.8
|
Andesite and dacite: slightly evolved profiles with negative Eu anomaly |
Andesite and dacite: negative anomalies in Nb, Ta, Sr and Ti |
Absence of basaltic rocks |
Intrusive Rocks
|
Stratigraphic or Lithological Unit |
Classification |
Affinity |
Tectonic Setting |
Mg# |
Rare Earths |
Spider Diagram |
Comments |
|---|---|---|---|---|---|---|---|
|
Felsic, Intermediate and Mafic Intrusive Rocks |
|||||||
|
Laflamme Pluton (mAlfl) |
Alkaline monzodiorite |
Calc-alkaline and metaluminous (type I) intrusive rocks, shoshonitic series indicated by the K2O content |
Volcanic arc granitoid |
Mean value: 54.1 |
Highly evolved profiles and having steep slopes |
Highly evolved profiles, strong negative anomalies in Nb, Ta and Ti |
Very stable contents in Y and SiO2, despite the diversity of Zr contents |
|
Amos Group (nAam) Felsic and intermediate intrusive rocks |
Mostly alkaline tonalite, quartz diorite and diorite Some tonalites resemble syenites and quartz syenites on the R1-R2 diagram. |
Calc-alkaline, mostly type I metaluminous diorite, suite ranging from enriched in K2O to shoshonitic; Calc-alkaline, mostly type S metaluminous tonalite |
Tonalite: volcanic arc granitoid; Diorite: volcanic arc granitoid with intra-plate context |
Mean values Tonalite = 13.3; Quartz diorite = 61.1; Diorite = 26.3 |
Tonalite and diorite: similar evolved profiles; Tonalite: slight Eu anomaly |
Tonalite and diorite: negative anomalies in Nb, Ta, P and Ti (strong) |
Tonalite, quartz diorite and diorite: very similar rare earth profiles |
|
Figuery and Lac Arthur groups and Landrienne Formation (nAfg, nAur, nAla) Tonalite and diorite |
Subalkaline tonalite and diorite |
Calc-alkaline, type I metaluminous tonalite and diorite (nAfg, nAla); Calc-alkaline peraluminous tonalite (nAur) |
Tonalite (nAfg): volcanic arc granitoid Tonalite (nAla, nAur) and diorite (nAur): within-plate context |
Tonalite (nAfg) = 53.5; Tonalite (nAur) = 18.3; Diorite (nAur) = 50.5; Tonalite (nAla) = 21.3
|
Tonalite (nAla, nAur) and diorite (nAur): evolved profiles with negative Eu anomaly |
Tonalite (nAla, nAur): strong anamalies in Sr, P and Ti; Diorite (nAur): weak negative anomalies in Sr and Ti; Tonalite (nAfg): strong negative anomalies in Nb and Ta |
Highly contrasting profiles of tonalites the Lake Arthur Group and Landrienne Formation compared to those of the Figuery Group. |
|
Amos, Figuery, and La Morandière groups, Landrienne and Deguisier formations (nAam, nAfg, nAmr, nAla and nAdg)
|
Magnesian subalkaline gabbro |
Gabbros of tholeiitic suites |
Source: N-MORB which would have experienced crustal contamination |
Mean values: nAmr = 50.0; nAla = 55.4; nAam = 48.1; nAdg = 50.1; nAfg = 38.2 |
nAam, nAla, nAmr: flat profiles; nAdg and nAfg: slightly evolved profiles |
nAam, nAla, nAmr: positive anomalies in Cs and Rb; nAdg and nAfg: negative anomalies in Nb and Ta |
Highly contrasted profiles of gabbros of the Amos and Figuery groups, Landrienne and Deguisier formations compared to those of the La Morandière Group (rare earth profiles with a much steeper slope). |
|
Diabase dykes (pPbis) and diabase |
Ferriferous subalkaline gabbro |
Diabases of tholeiitic suites |
Source: trend towards E-MORB |
pPbis = 40.2; Diabase = 38.5 |
Similar profiles, slightly evolved for both types |
Similar profiles for both types, slight negative anomalies in Nb and Ta; positive anomalies in Cs, Pb and Nd |
Rare earth profiles very similar between pPbis and N-S oriented diabase swarms. Possibility of genetic affiliation between these two swarms. |
|
Stratigraphic or Lithological Unit |
Classification |
Affinity |
Tectonic Setting |
Mg# |
Rare Earths |
Spider Diagram |
Comments |
|---|---|---|---|---|---|---|---|
|
Ultramafic Intrusive Rocks |
|||||||
|
Amos Group and Deguisier Formation (nAam and nAdg) |
Peridotite (lherzolite) nAam: two suites, one enriched and the other depleted in Al2O3; nAdg: suite depleted in Al2O3; High MgO contents indicate the presence of cumulates. |
Tholeiitic suite
|
Source: N-MORB which would have experienced crustal contamination |
Mean values: nAma = 76.1; nAdg = 79.1 |
nAam: two families of flat profiles, one very depleted; nAdg: one family of flat profiles |
Positive Cs anomaly; Negative anomalies in Nb, Ta, K and P (weak) |
The MgO content vs. major elements is used as a magmatic differentiation index. Major oxides display a negative correlation with MgO, trends that are compatible with evolution by a fractional crystallization process. |
References
Publications of the Government of Québec
PILOTE, P., DAIGNEAULT, R., MOORHEAD, J. 2018. Géologie de la région de Barraute Ouest, Sous-Province de l’Abitibi, région de l’Abitibi-Témiscamingue, Québec, Canada. MERN. BG 2018-05, 2 plans
PILOTE, P., MARLEAU, J., DAVID, J. 2019. Géologie de la région de Barraute, Sous-Province de l’Abitibi, région de l’Abitibi-Témiscamingue, Québec, Canada. MERN. BG 2019-06, 2 plans.
Other Publications
CABANIS, B., LECOLLE, M., 1989. Le diagramme La/10-Y/15-Nb/8: un outil pour la discrimination des séries volcaniques et la mise en évidence des processus de mélange et/ou de contamination crustale. Comptes rendus de l’Académie des Sciences. Série 2, Mécanique, Physique, Chimie, Sciences de l’univers, Sciences de la Terre; volume 309, pages 2023-2029.
DEBON, F., Le FORT, P., 1983. A chemical-mineralogical classification of common plutonic rocks and associations. Transactions of the Royal Society of Edinburgh, Earth Sciences; volume 73, pages 135-149. doi.org/10.1017/S0263593300010117
DE LA ROCHE, H., LETERRIER, J., GRANDCLAUDE, P., MARCHAL, M., 1980. A classification of volcanic and plutonic rocks using R1-R2 diagrams and major element analyses – its relationships with current nomenclature. Chemical Geology; volume 29, pages 183-210. doi.org/10.1016/0009-2541(80)90020-0
HARKER, A., 1909. The natural history of igneous rocks. Macmillan, New York.
HARRIS, N.B.W., PEARCE, J.A., TINDLE, A.G., 1986. Geochemical characteristics of collision-zone magmatism. In: COWARD, M.P. and REIS, A.C. (editor.), Collision tectonics. Geological Society, London; Special Publications; volume 19, pages 67-81. doi.org/10.1144/GSL.SP.1986.019.01.04
JENSEN, L.S., PYKE, D.R., 1982. Komatiites in the Ontario portion of the Abitibi belt. In: Komatiites (Arndt, N.T. and Nesbitt, E.G., editors). Allen and Unwin, London, pages 147-157.
LEBAS, M.J., LE MAITRE, R.W., STRECKEISEN, A., ZANETTIN, B., 1986. A chemical classification of volcanic rocks based on the total alkali–silica diagram. Journal of Petrology; volume 27, pages 745-750. doi.org/10.1093/petrology/27.3.745
MACLEAN, W.H., BARRETT, T.J. 1993. Lithogeochemical techniques using immobile elements. Journal of Geochemical Exploration; volume 48, pages 109-133. doi.org/10.1016/0375-6742(93)90002-4
MANIAR, P.D., PICCOLI, P.M., 1989. Tectonic discrimination of granitoids. Geological Society of America Bulletin; volume 101, pages 635-643. doi.org/10.1130/0016-7606(1989)101<0635:TDOG>2.3.CO;2
MCDONOUGH, W.F., SUN, S.S., 1995. The composition of the Earth. Chemical Geology; volume 120, pages 223-253. doi.org/10.1016/0009-2541(94)00140-4
MESCHEDE, M., 1986. A method of discriminating between different types of mid-ocean ridge basalts and continental tholeitites with the Nb–Zr–Y diagram. Chemical Geology; volume 56, pages 207-218. doi.org/10.1016/0009-2541(86)90004-5
MIDDLEMOST, E.A.K. 1994. Naming materials in the magma/igneous rock system. Earth-Sciences Reviews; volume 37, pages 215-224. doi.org/10.1016/0012-8252(94)90029-9
PEARCE, J.A., 2008. Geochemical fingerprinting of oceanic basalts with applications to ophiolite classification and the search for Archean oceanic crust. Lithos; volume 100, pages 14–48. doi.org/10.1016/j.lithos.2007.06.016
PEARCE, J.A., HARRIS, B.W., TINDLE, A.G., 1984. Trace element discrimination diagram for tectonic interpretation of granitic rocks. Journal of Petrology; volume 25, pages 956-983. doi.org/10.1093/petrology/25.4.956
PECCERILLO, A., TAYLOR, S.R., 1976. Geochemistry of Eocene calc-alkaline volcanic rocks from the Kastamonu area, northern Turkey. Contributions to Mineralogy and Petrology; volume 58, pages 63-81. doi.org/10.1007/BF00384745
ROSS, P.-S., BÉDARD, J.H., 2009. Magmatic affinity of modern and ancient subalkaline volcanic rocks determined from trace-element discriminant diagrams. Canadian Journal of Earth Science; volume 46, pages 823-839. doi.org/10.1139/E09-054
SUN, S.S., MCDONOUGH, W.F., 1989. Chemical and isotopic systematics of oceanic basalts: implications for mantle composition and processes. In Saunders, A.D., Norry, J. (editors), Magmatism in the Ocean Basin. Geological Society of London, Special Publication; volume 42, pages 313-345. doi.org/10.1144/GSL.SP.1989.042.01.19
WINCHESTER, J.A., FLOYD, P.A., 1977. Geochemical discrimination of different magma series and their differentiation products using immobile elements. Chemical Geology; volume 20, pages 325-343. doi.org/10.1016/0009-2541(77)90057-2
WOOD, D.A., 1980. The application of a Th–Hf–Ta diagram to problems of tectonomagmatic classification and to establishing the nature of crustal contamination of basaltic lavas of the British Tertiary volcanic province. Earth and Planetary Science Letters; volume 50, pages 11-30. doi.org/10.1016/0012-821X(80)90116-8