
Lithogeochemistry of Geological Units in the Parent Lake Area
The tables below summarize the lithogeochemical characteristics of geological units in the Parent Lake area. These units are described in the Geological Bulletin of the Parent Lake area covering this territory and in the Quebec Stratigraphic Lexicon. The 153 analyses used here come from samples collected during the Ministère‘s mapping campaign in the summer of 2019. They were selected based on certain criteria, including a sum of major oxides between 98.5% and 101.5% and a loss on ignition (LOI) <3%. These analyses were conducted by the Actlabs laboratory in Ancaster, Ontario.
Analyses were subject to an internal and laboratory quality assurance and control process. Thus, to ensure the accuracy and precision of the values provided by the laboratory, the Bureau de la connaissance géoscientifique du Québec (BCGQ) regularly inserts blanks, standards and duplicates. Reference materials represent ~10% of the analyses.
The majority of samples in the database were analyzed for major oxides, trace elements and metals. Analyses were performed using different techniques depending on elements, such as inductively coupled plasma mass spectrometry (ICP-MS), inductively coupled plasma optical emission spectrometry (ICP-AES) and neutron activation (INAA). For more information on the analysis and dissolution techniques used, refer to the information available for each sample in SIGÉOM à la carte.
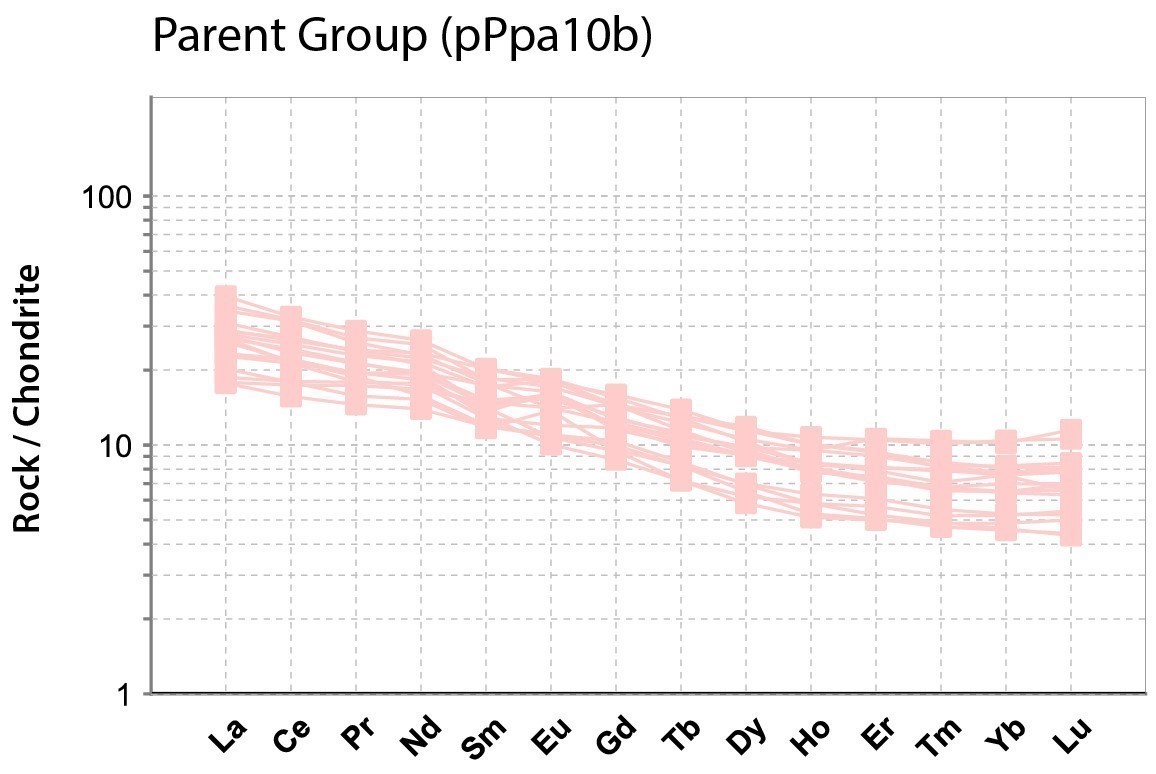
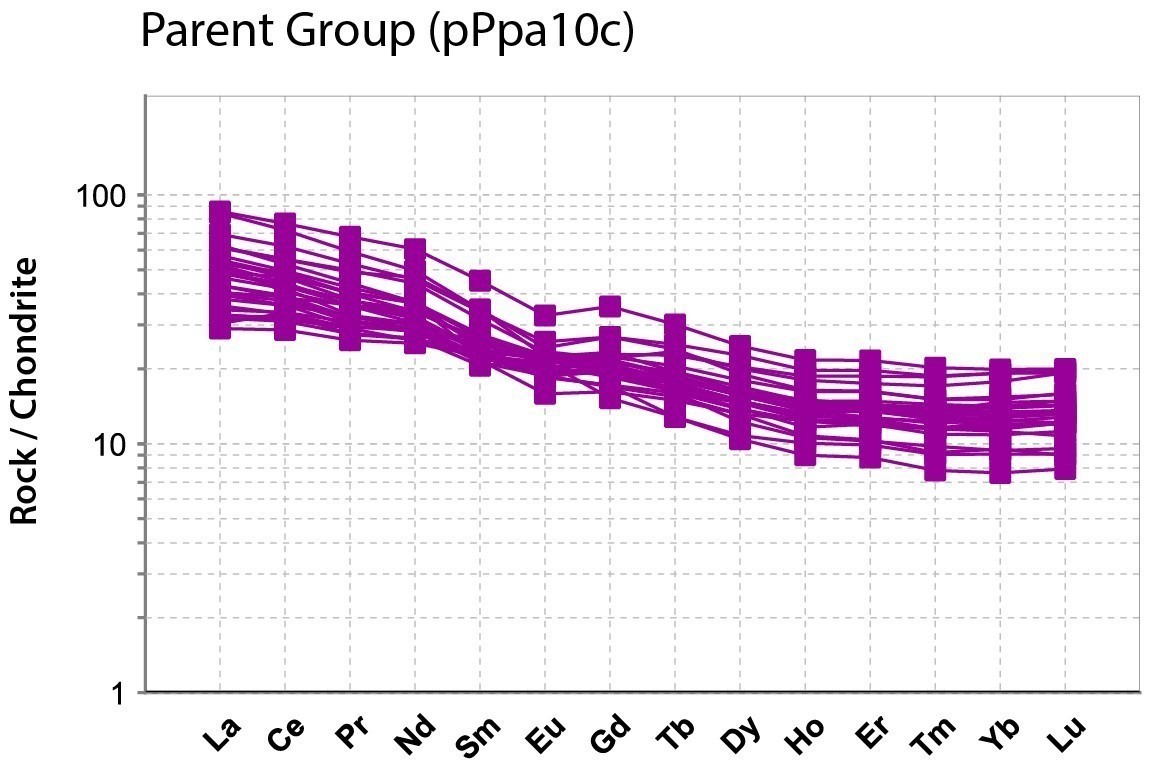
Rare earth elements are normalized according to the values of Palme and O’Neill (2004). Anomalous, distinctive or significant contents are indicated in bold in the tables.
Supracrustal Rocks
The Parent Group corresponds to the southern half of sheet 35G11. The rock’s lithogeochemical characteristics were used to discriminate units. Most rare earth patterns display negative Nb-Ta anomalies with a strong negative slope, indicating an arc setting. However, a few units display more of a flat spider diagram, typical of oceanic rift environments. The distribution of Parent Group units is complex and their emplacement cannot be explained simply by the development of a volcanic arc. Indeed, other factors could influence the geochemical signatures of the rocks, such as crustal contamination or the presence of several contemporaneous magmatic chambers.
Stratigraphic or Lithological Unit |
Classification | Affinity |
Tectonic setting | Mg# |
Rare Earths | Spider Diagram | Comments |
|---|---|---|---|---|---|---|---|
| |||||||
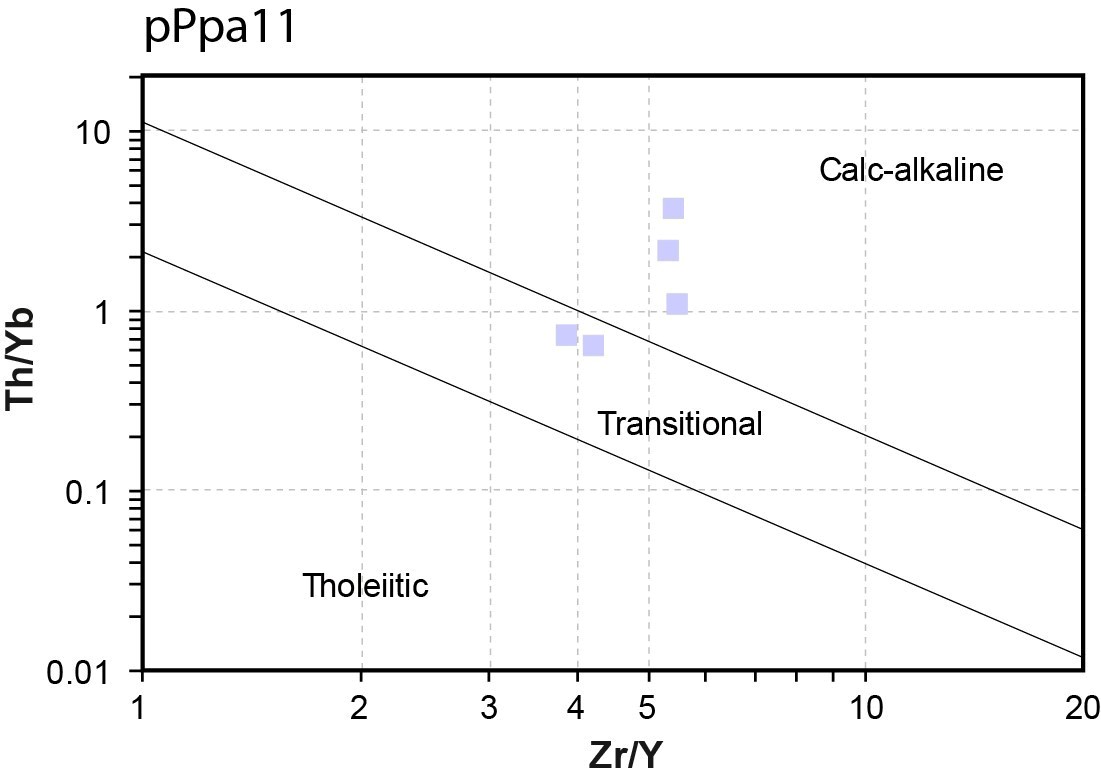
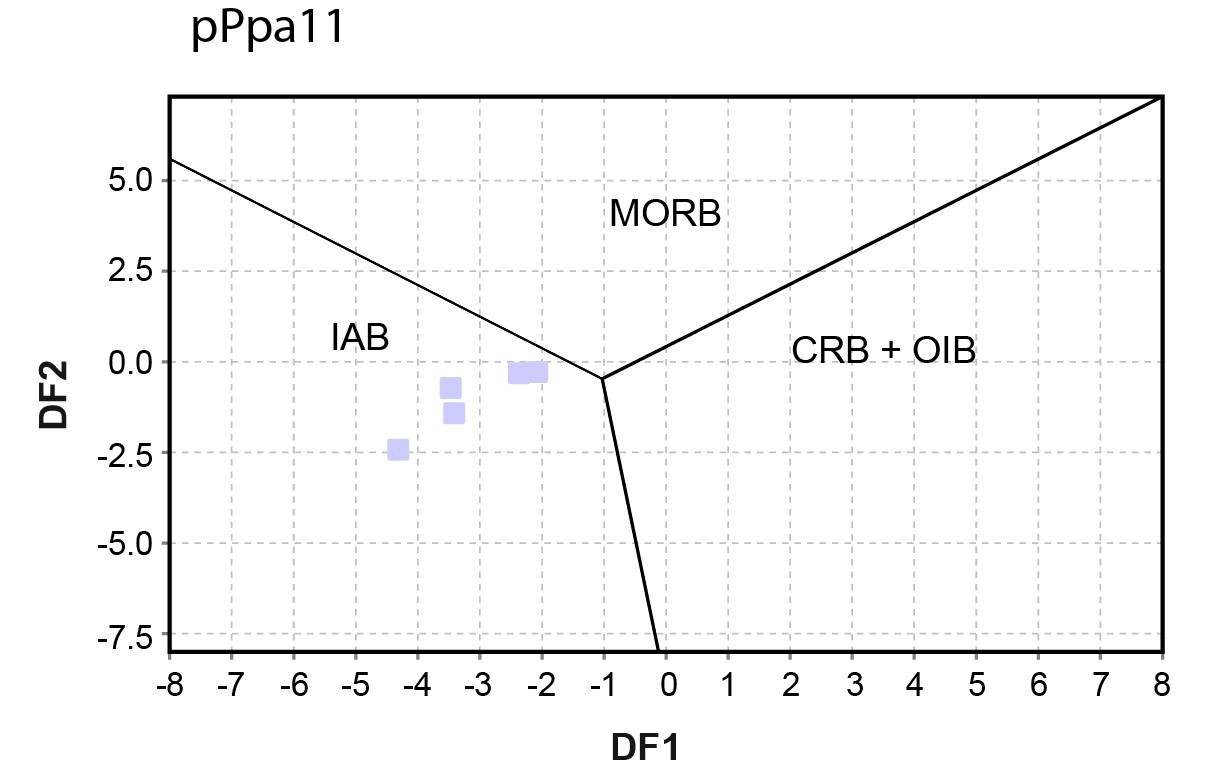
Dacite (pPpa11) | Dacite | Transitional to calc-alkaline | Island arc | 11.75-18.82 | 2.24 < (La/Yb)N < 8.15 1.63 < (La/Sm)N < 3.41 1.24 < (Gd/Yb)N < 1.69 0.76 < Eu/Eu* < 0.98 | Strong negative anomalies in Nb, Ta and Ti; Weak positive anomalies in Th and La | Spider diagram with a steep positive slope |
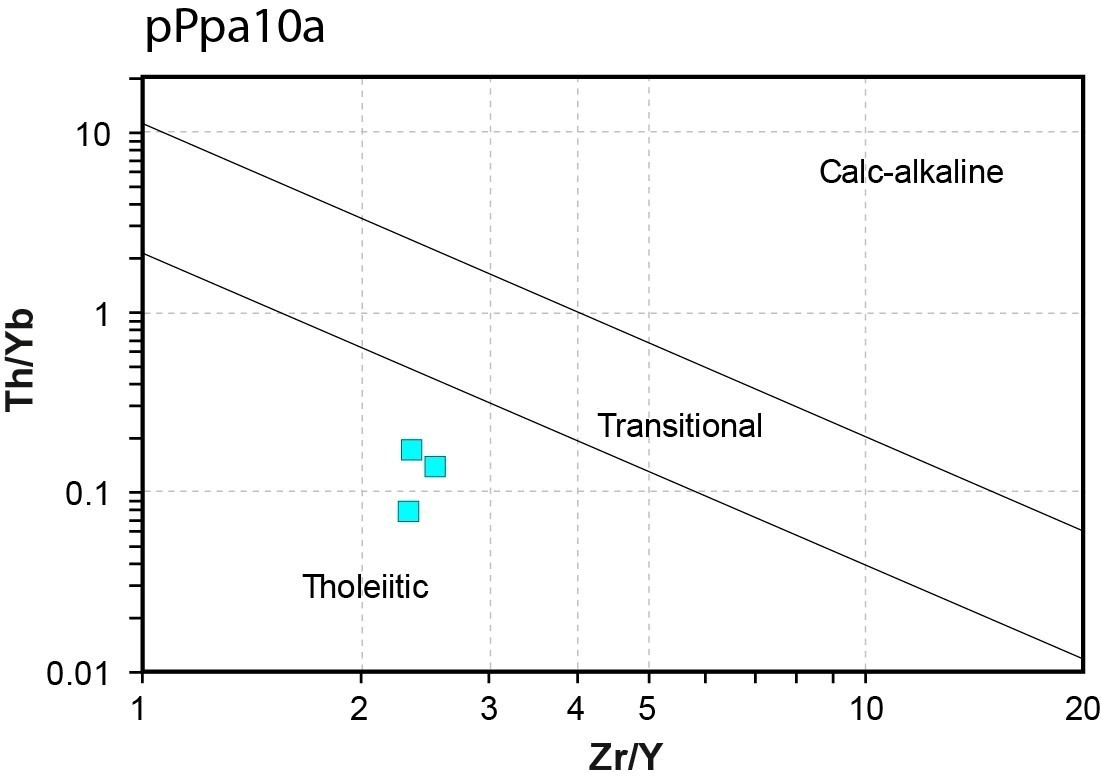
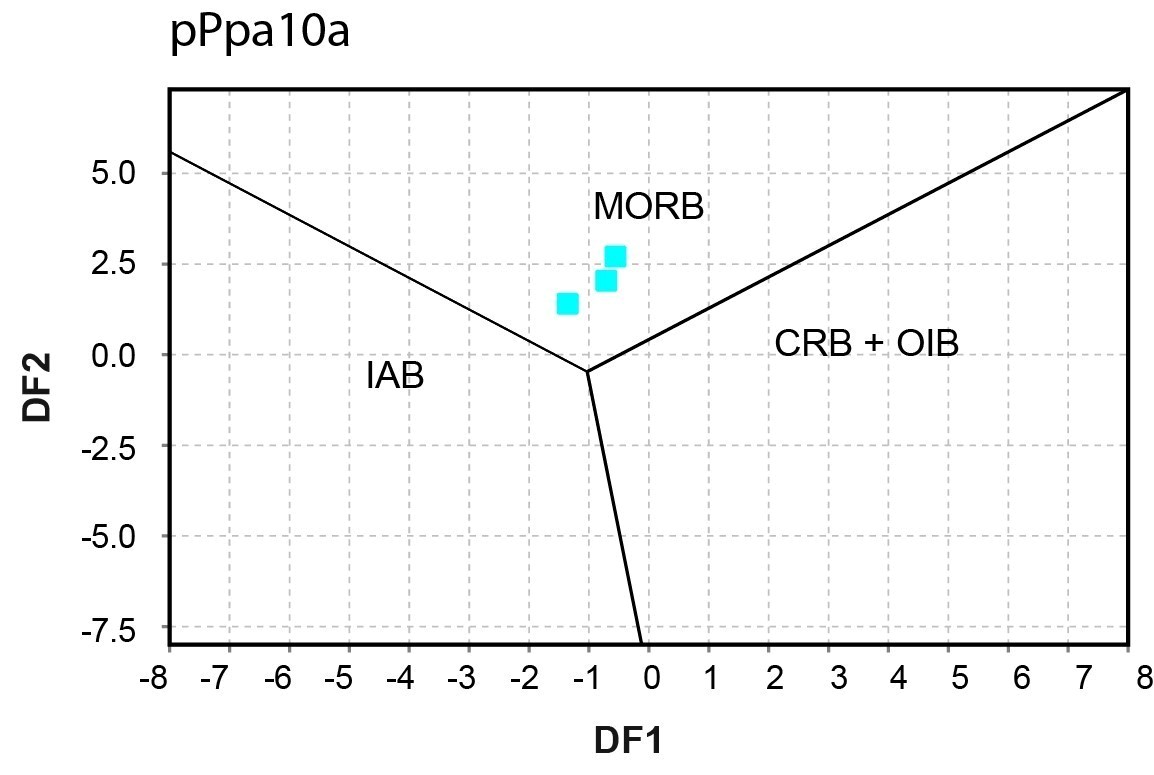
Clinopyroxene porphyritic basaltic lava and volcaniclastics; Tholeiitic basalt (pPpa10a) | Basalt | Tholeiitic | MORB
| 36.49-40.76 | 1.03 < (La/Yb)N < 1.63 0.92 < (La/Sm)N < 1.29 1.14 < (Gd/Yb)N < 1.38 0.91 < Eu/Eu* < 1.16 | Weak anomaly in Th | Relatively flat spider diagram |
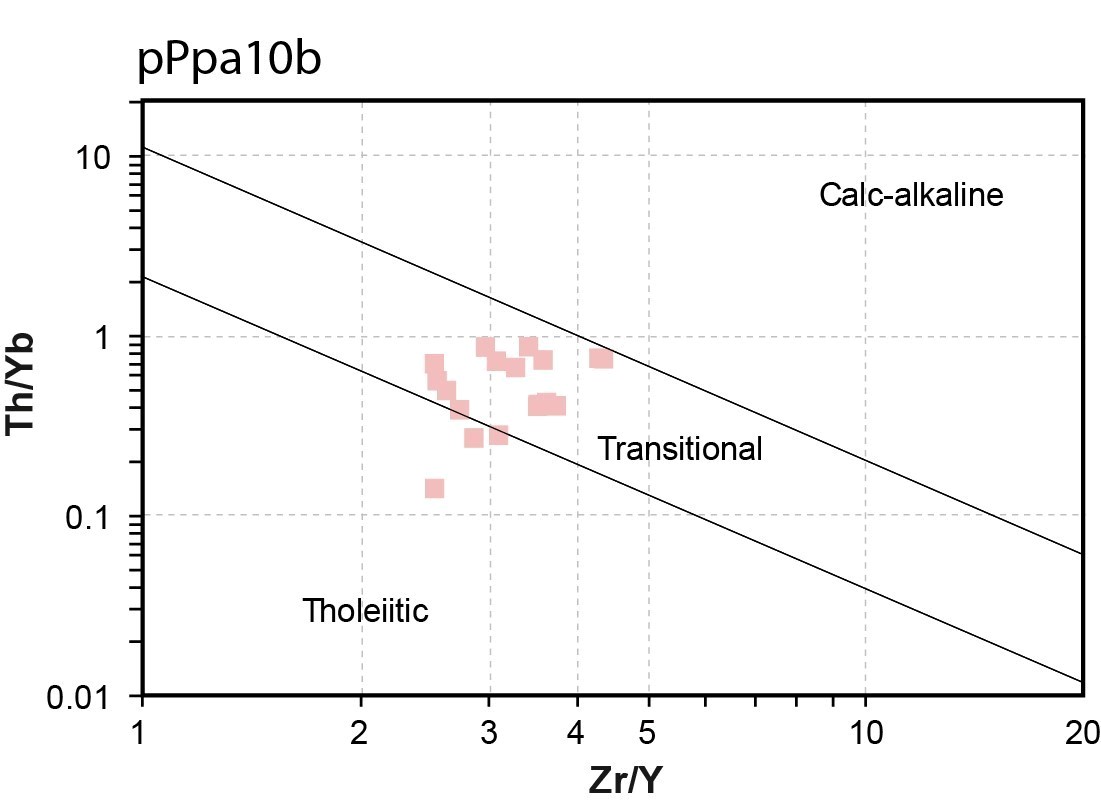
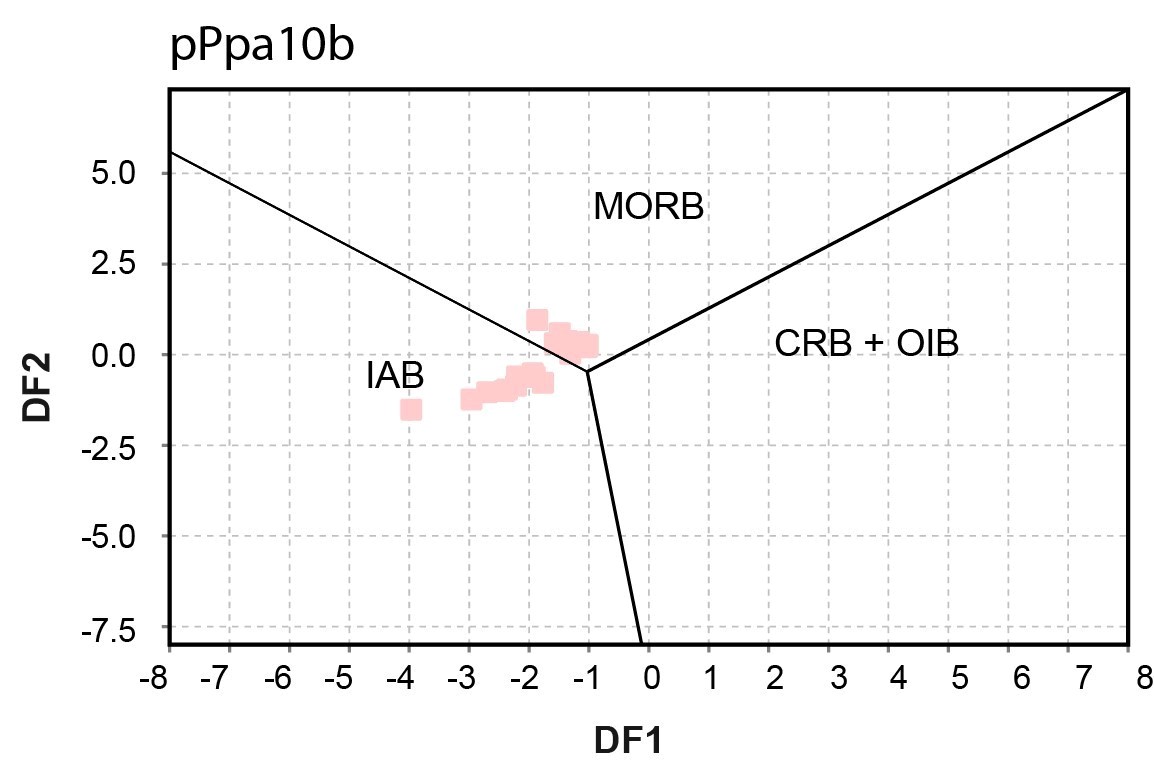
Clinopyroxene porphyritic basaltic lava and volcaniclastics; Tholeiitic to transitional basalt (pPpa10b) | Basalt | Transitional to tholeiitic | Island arc basalt to MORB | 19.02-57.17 | 2.23 < (La/Yb)N < 5.93 1.20 < (La/Sm)N < 2.18 1.195 < (Gd/Yb)N < 2.25 0.87 < Eu/Eu* < 1.29 | Negative anomalies in Nb, Ta, Zr, Hf and Ti; Weak positive anomalies in La and Eu | Spider diagram with a positive slope; low Zr content |
Clinopyroxene porphyritic basaltic and andesitic extrusive rocks and volcaniclastics; Transitional to calc-alkaline basalt and andesite (pPpa10c) | Basalt and andesite | Transitional to calc-alkaline | Island arc basalt to MORB | 21.60-57.58 | 1.71 < (La/Yb)N < 8.23 1.28 < (La/Sm)N < 2.85 1.19 < (Gd/Yb)N < 2.10 0.79 < Eu/Eu* < 1.16 | Negative anomalies in Nb and Ti; Weak positive anomaly in La | Spider diagram witha positive slope, high Zr content |
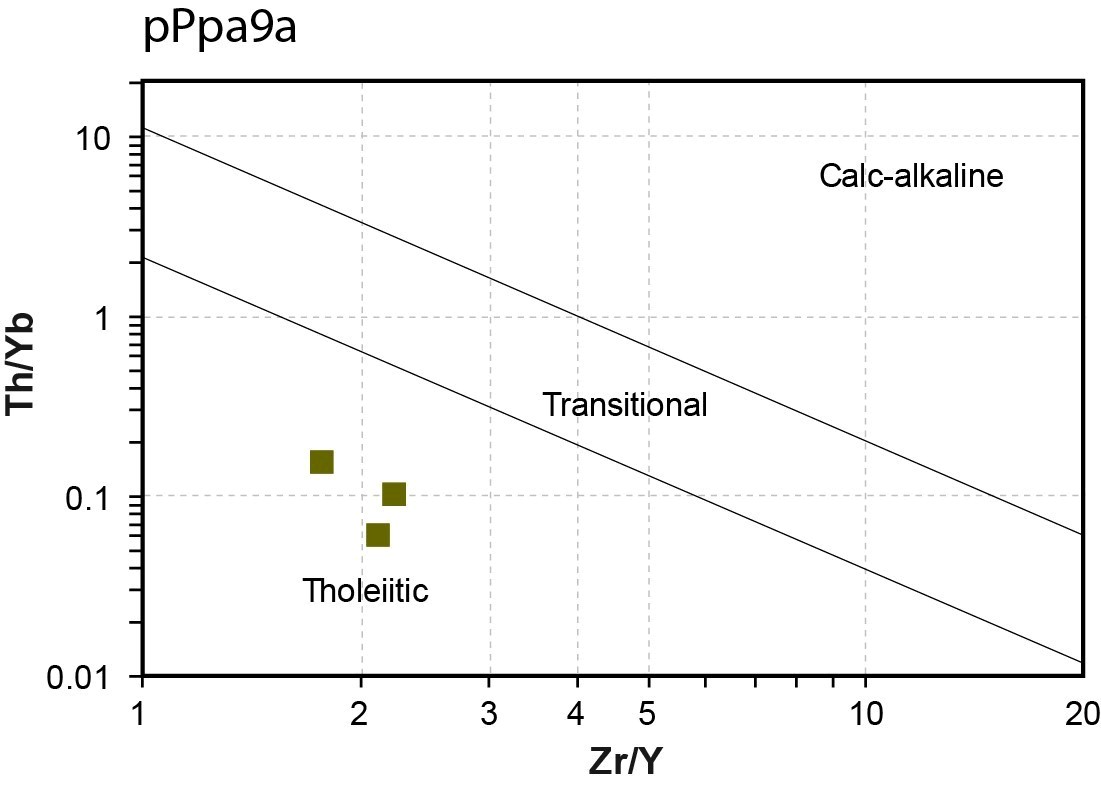
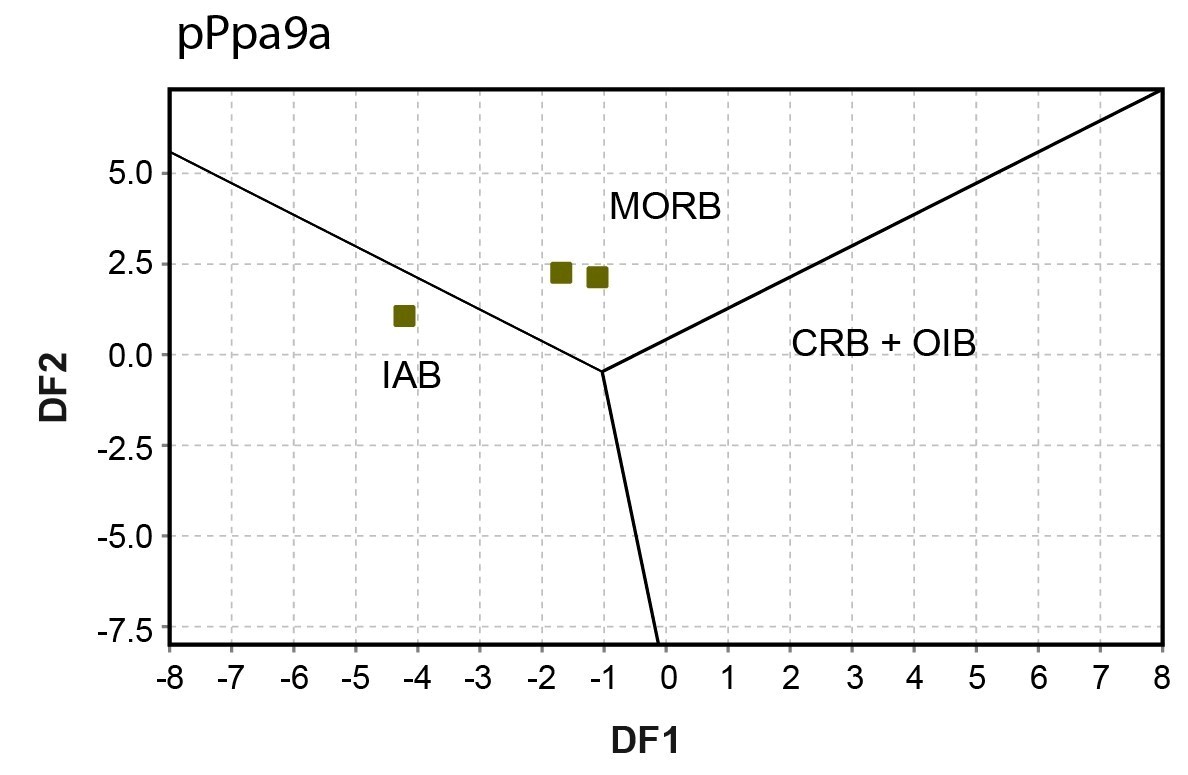
Aphyric basaltic extrusive rocks and volcaniclastics; Tholeiitic basalt (pPpa9a) | Basalt | Tholeiitic | MORB | 30.04-51.43 | 0.41 < (La/Yb)N < 0.93 0.60 < (La/Sm)N < 0.90 0.87 < (Gd/Yb)N < 1.22 0.82 < Eu/Eu* < 1.02 | Weak negative anomaly in Zr | Flat spider diagram with a slightly positive slope |
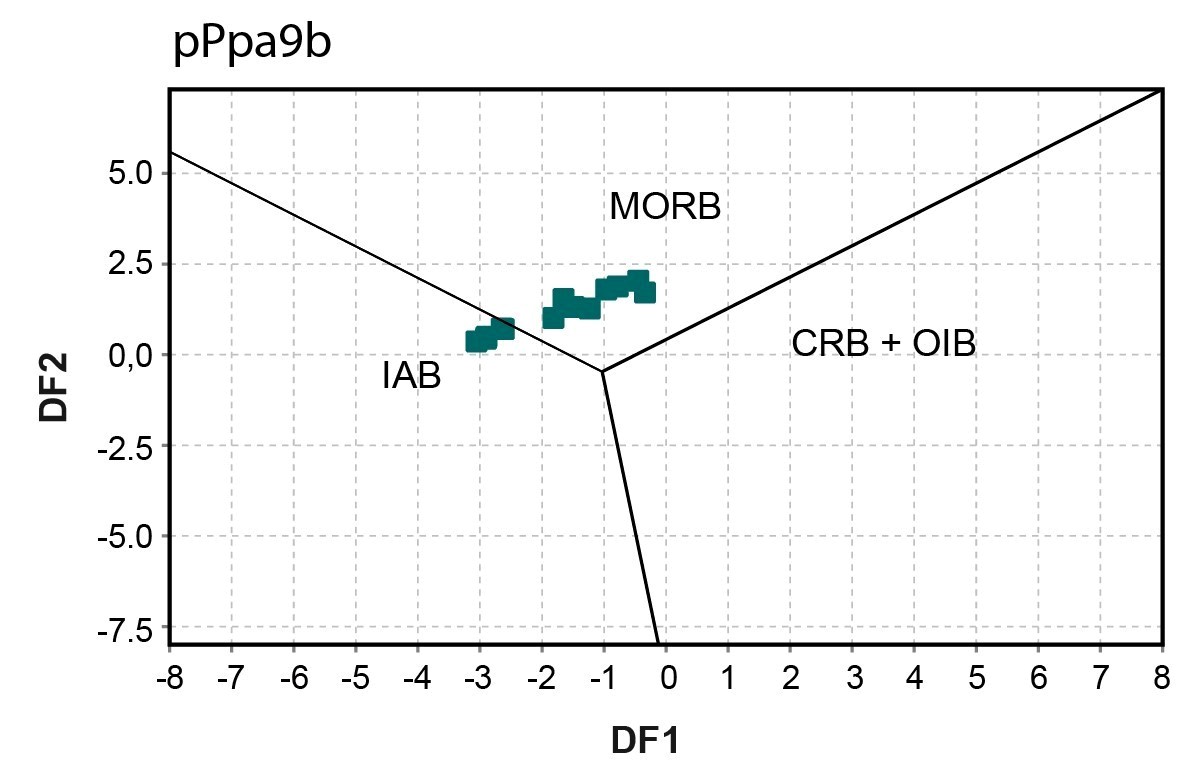
Aphyric basaltic extrusive rocks and volcaniclastics; Tholeiitic to transitional basalt (pPpa9b) | Basalt | Tholeiitic to transitional | Island arc basalt to MORB | 22.55-40.27 | 1.42 < (La/Yb)N < 1.99 0.97 < (La/Sm)N < 1.6 1.13 < (Gd/Yb)N < 1.48 0.82 < Eu/Eu* < 1.05 | Weak negative anomalies in Nb, Ta and Ti | Relatively flat spider diagram |
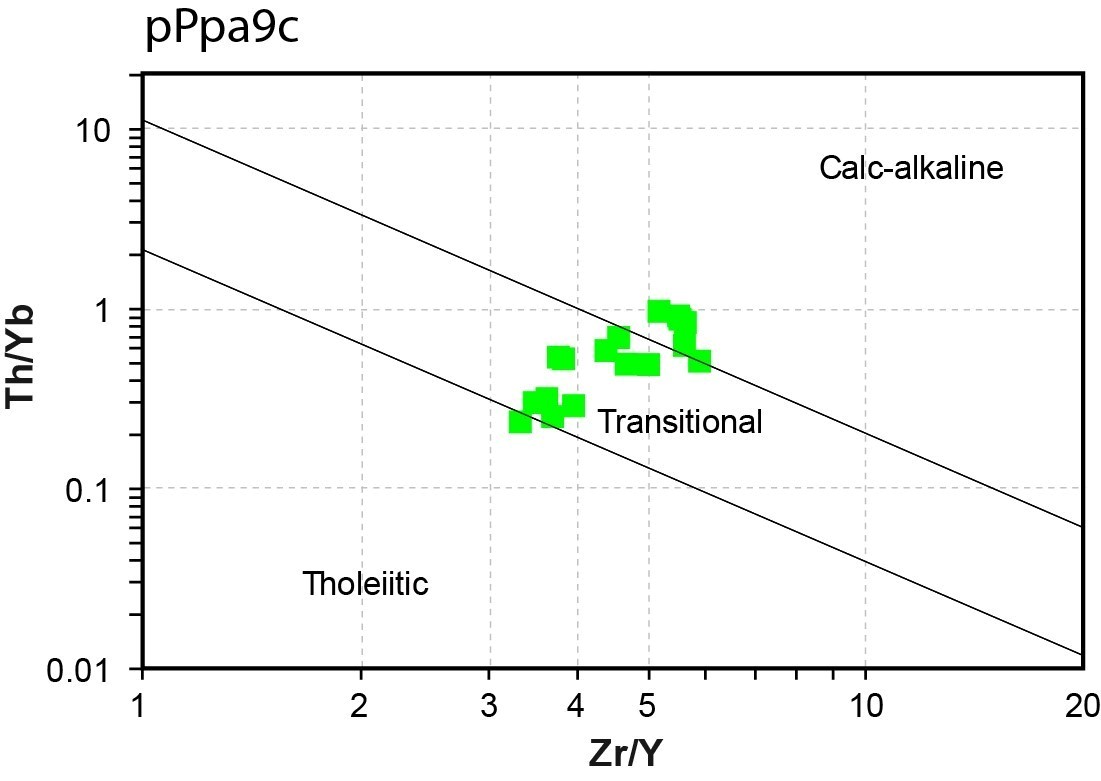
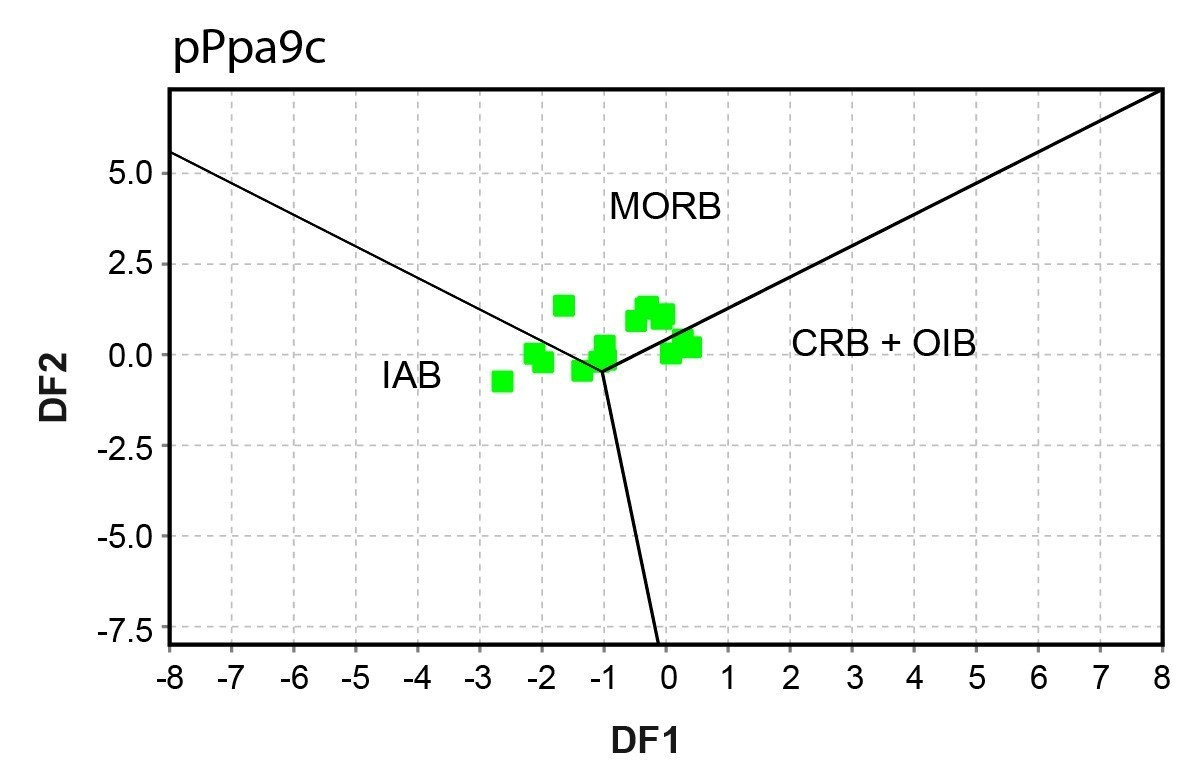
Aphyric basaltic extrusive rocks and volcaniclastics; Transitional to calc-alkaline basalt (pPpa9c) | Basalt: mobility of major elements could explain the points in the andesite field, since the composition vs trace elements diagram indicates that all samples fall in the basalt field. | Transitional to calc-alkaline | Variable settings | 10.80-49.63 | 1.83 < (La/Yb)N < 4.87 1.14 < (La/Sm)N < 2.21 1.30 < (Gd/Yb)N < 2.47 0.78 < Eu/Eu* < 1.20 | Weak negative anomaly in Th | Spider diagram with a slightly negative slope; variable anomalies in Ti |
Sedimentary Rocks | |||||||
Hubert Formation (pPhbt) | Polymictic conglomerate, red sandstone (Diagram) |
| 31.88-41.06 |
| |||
Intrusive Rocks
Intrusive rocks are particularly well represented in the northern part of sheet 35G11. Felsic intrusive rocks are limited in number and geographically limited. Mafic intrusive rocks are more abundant. Given the complex structure of the area, lithogeochemistry was used to clearly define units.
Stratigraphic or Lithological Unit | Classification | Affinity | Tectonic Setting | Mg# | Rare Earths | Spider Diagram | Comments |
|---|---|---|---|---|---|---|---|
Felsic to Intermediate Intrusive Rocks | |||||||
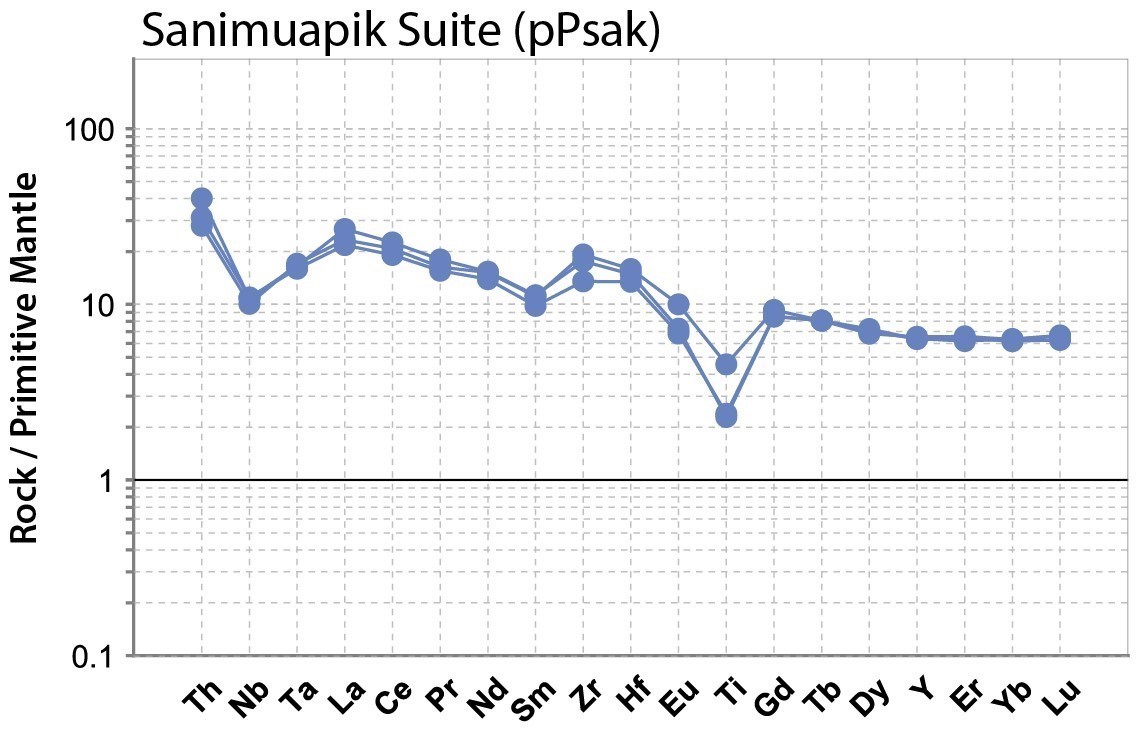
Sanimuapik Suite (pPsak) | Massive to foliated blue quartz tonalite | Type I-S granitoid |
| 16.28-18.18 | 3.42 < (La/Yb)N < 4.19 2.23 < (La/Sm)N < 2.39 1.34 < (Gd/Yb)N < 1.36 0.74 = Eu/Eu* | Negative anomalies in Nb and Ti
| |
Niviugak Suite (pPnvk) | Speckled and foliated quartz diorite | Type I-S granitoid | 27.58-29.52 | 2.33 < (La/Yb)N < 3.82 1.32 < (La/Sm)N < 1.90 1.40 < (Gd/Yb)N < 1.58 0.70 < Eu/Eu* < 0.79 | Negative anomaly in Ti | ||
Qaqortoq Granite (pPqqq) (1 sample) | Massive granite | 12.51
| (La/Yb)N = 3.15 (La/Sm)N = 3.15 (Gd/Yb)N = 0.60 Eu/Eu* = 1.52 | Negative anomaly in Ti | Only one sample for this unit | ||
Stratigraphic or Lithological Unit | Classification | Affinity | Tectonic Setting | Mg# | Rare Eaths | Spider Diagram | Comments |
|---|---|---|---|---|---|---|---|
Mafic-Ultramafic Intrusive Rocks and Associated Lithologies | |||||||
Vanasse Suite (pPvas) | Homogenous, massive to foliated gabbro and gabbronorite | Transitional to tholeiitic | Variable tectonic settig: mainly in the field continental rift basalt (CRB), oceanic arc basalt (OIB) and island arc basalt (IAB) | 29.70-43.24 | 4.01 < (La/Yb)N < 11.97 1.27 < (La/Sm)N < 2.67 1,70 < (Gd/Yb)N < 2.72 0.85 < Eu/Eu* < 1.40 | Strong negative anomalies in Th, Nb, Ta, Zr, Hf, Ti. | Spider diagram with a steep slope |
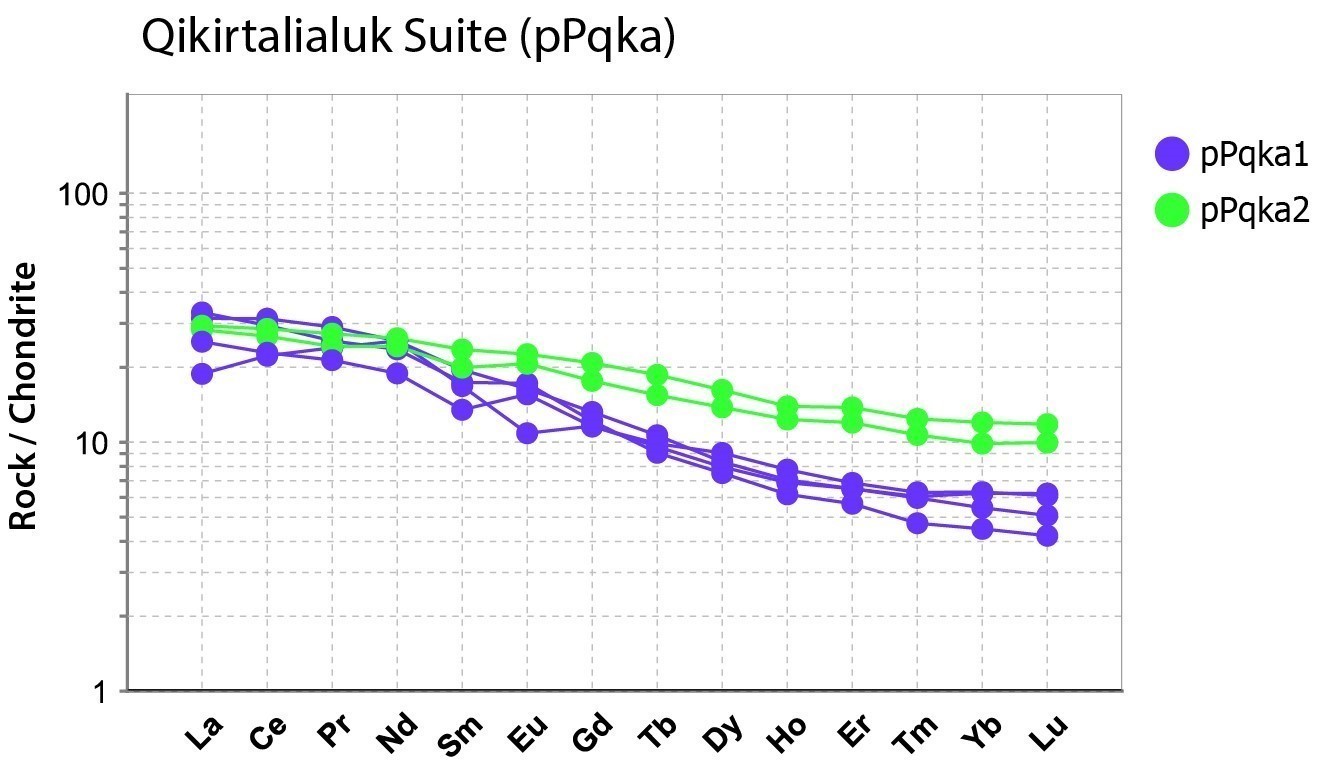
Qikirtalialuk Suite(pPqka) | Heterogeneous gabbro | Transitional to tholeiitic | Variable setting | 23.80-50.85 | 1.84 < (La/Yb)N < 4.02 0.83 < (La/Sm)N < 1.88 1.48 < (Gd/Yb)N < 2.50 0.91 < Eu/Eu* < 1.07 | Negative anomalies in Zr and Hf for pPqka1. Slight negative anomaly in Th for pPqka2. | The heterogeneity of the rock (numerous enclaves and several structures) could be reflected in the geochemical signature of this unit. |
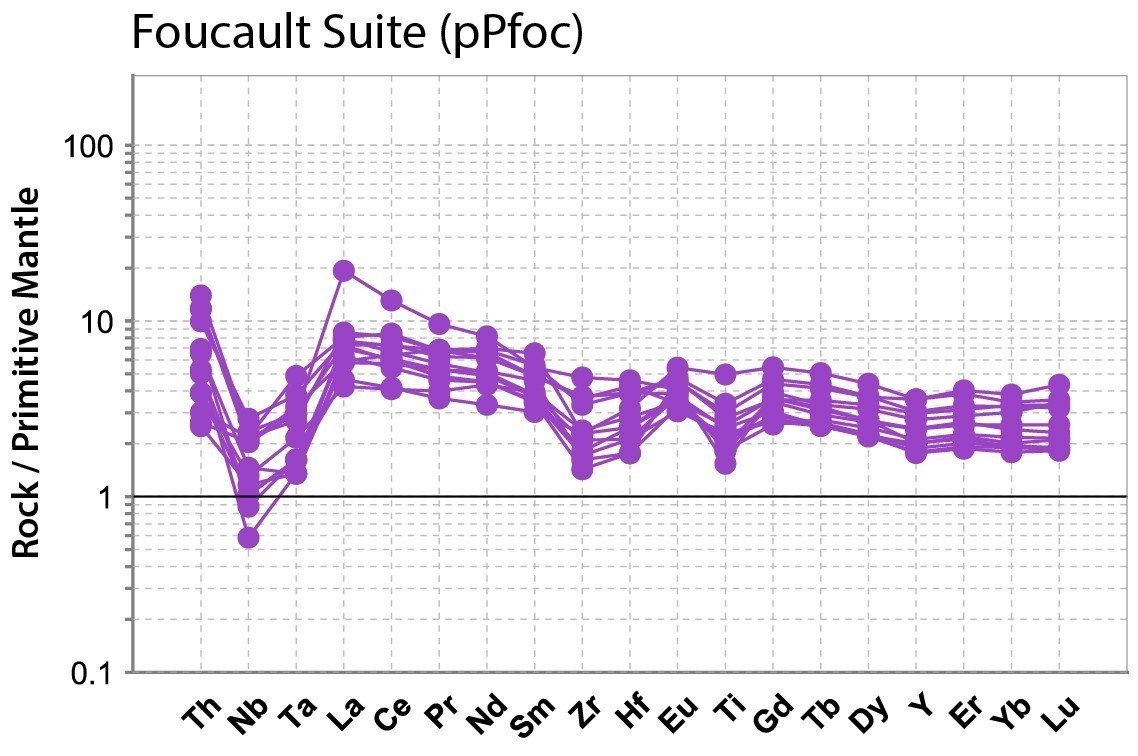
Foucault Suite (pPfoc) | Variable composition, mainly gabbro to diorite | Transitional to tholeiitic | Island arc basalt to MORB | 21.73-41.45 | 1.69 < (La/Yb)N < 4.01 0.90 < (La/Sm)N < 2.08 1.07 < (Gd/Yb)N < 1.58 0.81 < Eu/Eu* < 1.13 | Strong negative anomalies in Nb, Ta and slight negative anomalies in Zr, Hf, Ti. | Slightly negative slope |
Iqiat Suite (pPiqa) | Heterogeneous, massive to foliated gabbro and diorite | Transitional to calc-alkaline | Island arc basalt | 2.,18-44.12 | 3.87 < (La/Yb)N < 8.24 1.42 < (La/Sm)N < 2.94 1.48 < (Gd/Yb)N < 2.10 0.84 < Eu/Eu* < 1.39 | Slight negative anomalies in Nb and Ta | Could be distinguished from other gabbroic intrusive rocks by its calc-alkaline to transitional affinity. |
References
Other Publications
AGRAWAL, S., 2008. Tectonic discrimination of basic and ultrabasic volcanic rocks through log-transformed ratios of immobile trace elements. International Geology Review; volume 50, pages 1057-1079. doi.org/10.2747/0020-6814.50.12.1057
DE LA ROCHE, H., LETERRIER, J., GRANDCLAUDE, P., MARCHAL, M., 1980. A classification of volcanic and plutonic rocks using R1-R2 diagrams and major element analyses – its relationships with current nomenclature. Chemical Geology; volume 29, pages 183-210. doi.org/10.1016/0009-2541(80)90020-0
HERRON, M.H., 1988. Geochemical classification of terrigenous sands and shales from core or log data. Journal of Sedimentary Research; volume 58, pages 820-829. doi.org/10.1306/212F8E77-2B24-11D7-8648000102C1865D
MCDONOUGH, W.F., SUN, S.S., 1995. The composition of the Earth. Chemical Geology; volume 120, pages 223-253. doi.org/10.1016/0009-2541(94)00140-4
MIDDLEMOST, A.K., 1994 Naming materials in the magma/igneous rock system. Earth-Science Reviews; volume 37, pages 215-224. doi.org/10.1016/0012-8252(94)90029-9
PALME, H., O’NEILL, H.S.C., 2004. Cosmochemical estimates of mantle composition. In Treatise on Geochemistry. (Holland, H.D., Turrekian, K.K., editors), Elsevier; volume 2, pages 1-38. doi.org/10.1016/B978-0-08-095975-7.00201-1
ROSS, P.-S., BÉDARD, J.H., 2009. Magmatic affinity of modern and ancient subalkaline volcanic rocks determined from trace-element discriminant diagrams. Canadian Journal of Earth Science; volume 46, pages 823-839. doi.org/10.1139/E09-054
WHALEN, J.B., CURRIE, K.L., CHAPPELL, B.W., 1987. A-Type granites : Geochemical characteristics, discrimination and petrogenesis. Contributions to Mineralogy and Petrology; volume 95, pages 407-419. doi.org/10.1007/BF00402202
WINCHESTER, J.A., FLOYD, P.A., 1977. Geochemical discrimination of different magma series and their differentiation products using immobile elements. Chemical Geology; volume 20, pages 325-343. doi.org/10.1016/0009-2541(77)90057-2