
Lithogeochemistry of Geological Units of the George Lithotectonic Domain
The majority of these samples were analyzed for major oxides, trace elements and base metals. A few selected samples of ultramafic mafic rocks were also analyzed for platinum, palladium and gold. Analyses were performed by various techniques depending on elements, such as plasma-coupled induction mass spectrometry (ICP-MS), coupled induction optical plasma emission spectrometry (ICP-AES) and neutron activation (INAA).
In the tables below, for each geological unit analyzed, the samples’ rare earth element diagrams and ratios, as well as spider diagrams, are mostly represented by 25th to 75th percentile envelopes of the sample population. Such a representation was chosen to simplify visualization of numerous diagrams. Envelopes and ratios presented are therefore indicative. Anomal contents and distinctive trace element ratios, or considered important, are in bold type.
Gneissic rocks
Stratigraphic or Lithodemic Unit | Classification/Rock Type | Mg# | Rare Earth Elements | Spider Diagram |
|---|---|---|---|---|
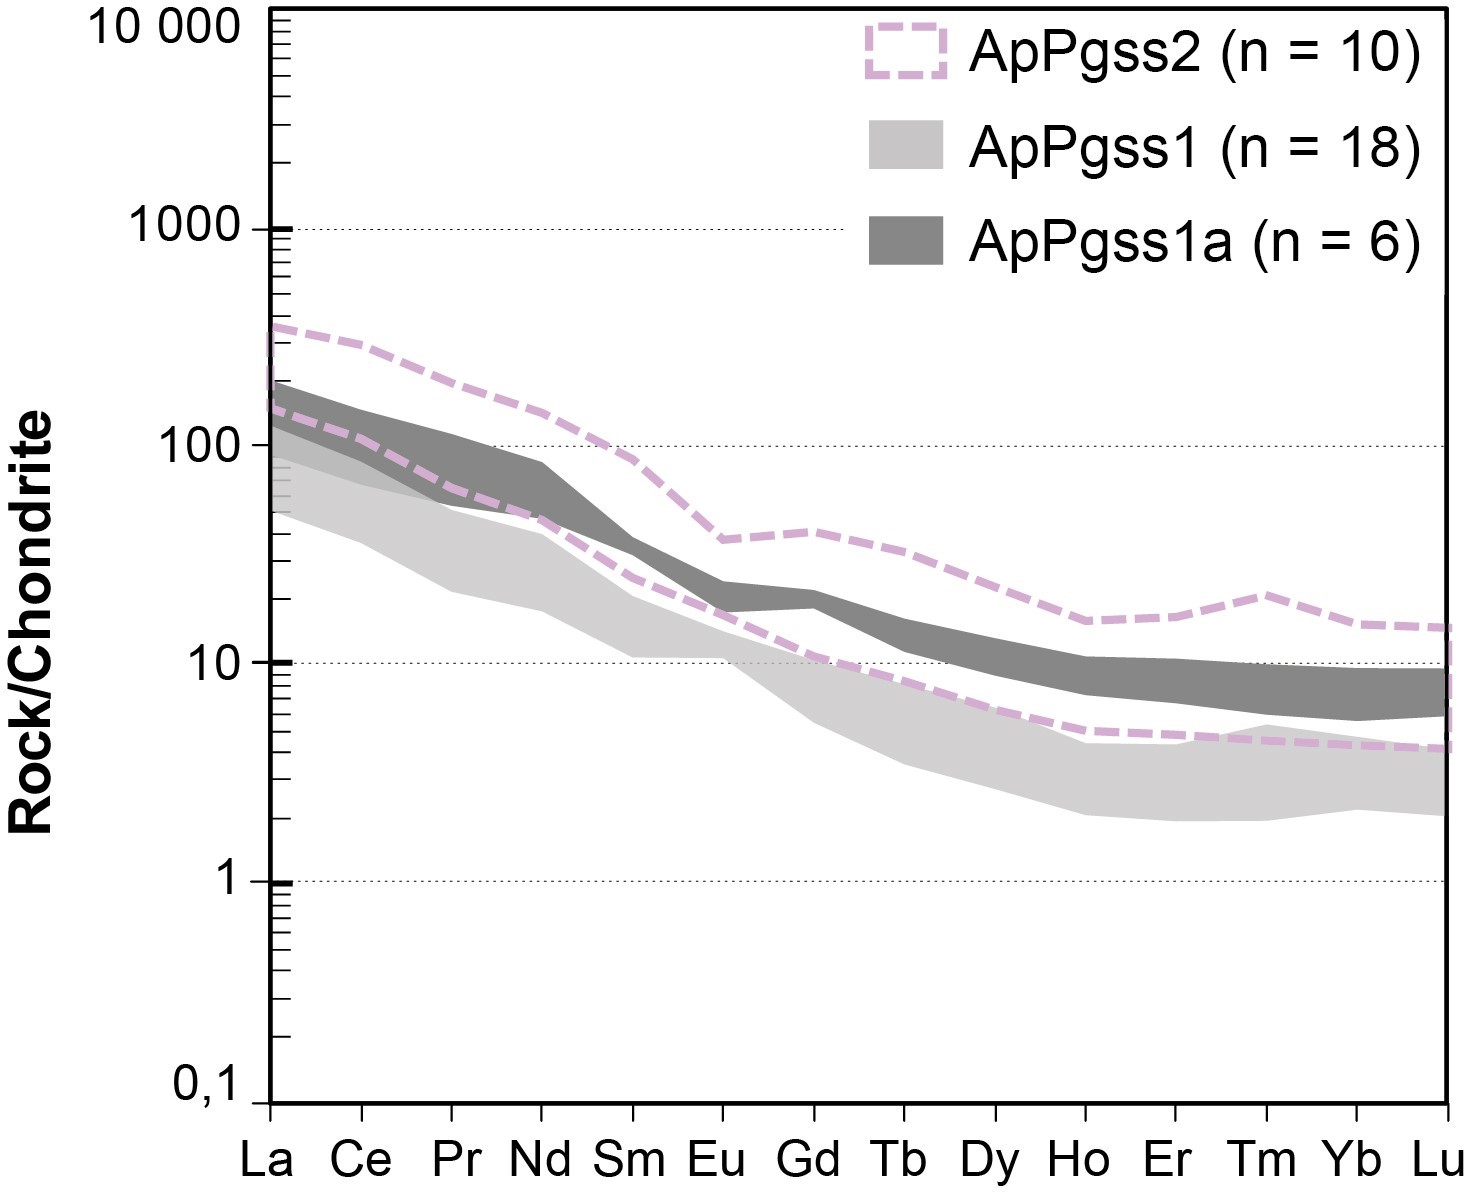
ApPgss1 and ApPgss1a | Tonalite and quartz diorite (Diagram) | 0.30-0.55 | 16.5 < (La/Yb)N < 26.4 2.8 < (La/Sm)N < 5.2 2.3 < (Gd/Yb)N < 3.3 0.7 < Eu/Eu* < 1.4 (Diagram) | Negative anomalies in: Ta‑Nb; P; Ti (Diagram) |
ApPgss2 | Granodiorite and monzogranite (Diagram) | 0.25-0.43 | 23.0 < (La/Yb)N < 34.6 4.1 < (La/Sm)N < 5.9 2.5 < (Gd/Yb)N < 2.6 0.6 < Eu/Eu* < 1.0 (Diagram) | Negative anomalies in: Ta‑Nb; P; Ti Positive anomalies in: Zr‑Hf; Tb (Diagram) |
Supracrustal Rocks
Stratigraphic or Lithodemic Unit | Classification/Rock Type | Affinity | Tectonic Setting | Mg# | Rare Earth Elements | Spider Diagram | Comments |
|---|---|---|---|---|---|---|---|
Volcanic and Associated Rocks | |||||||
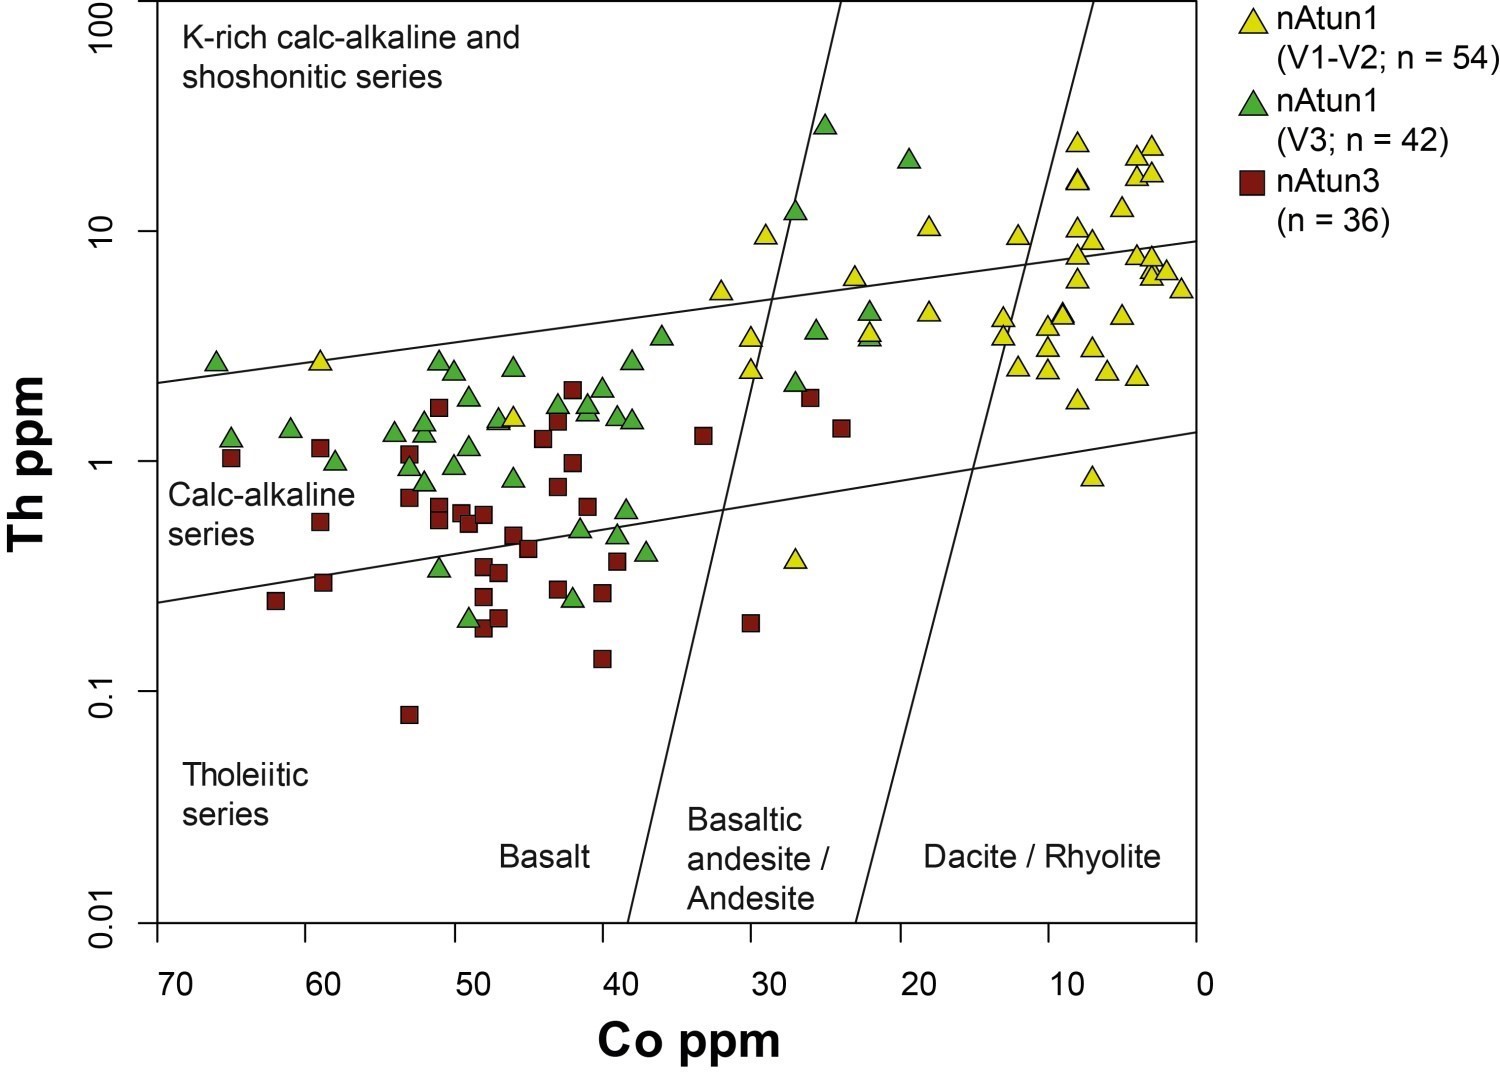
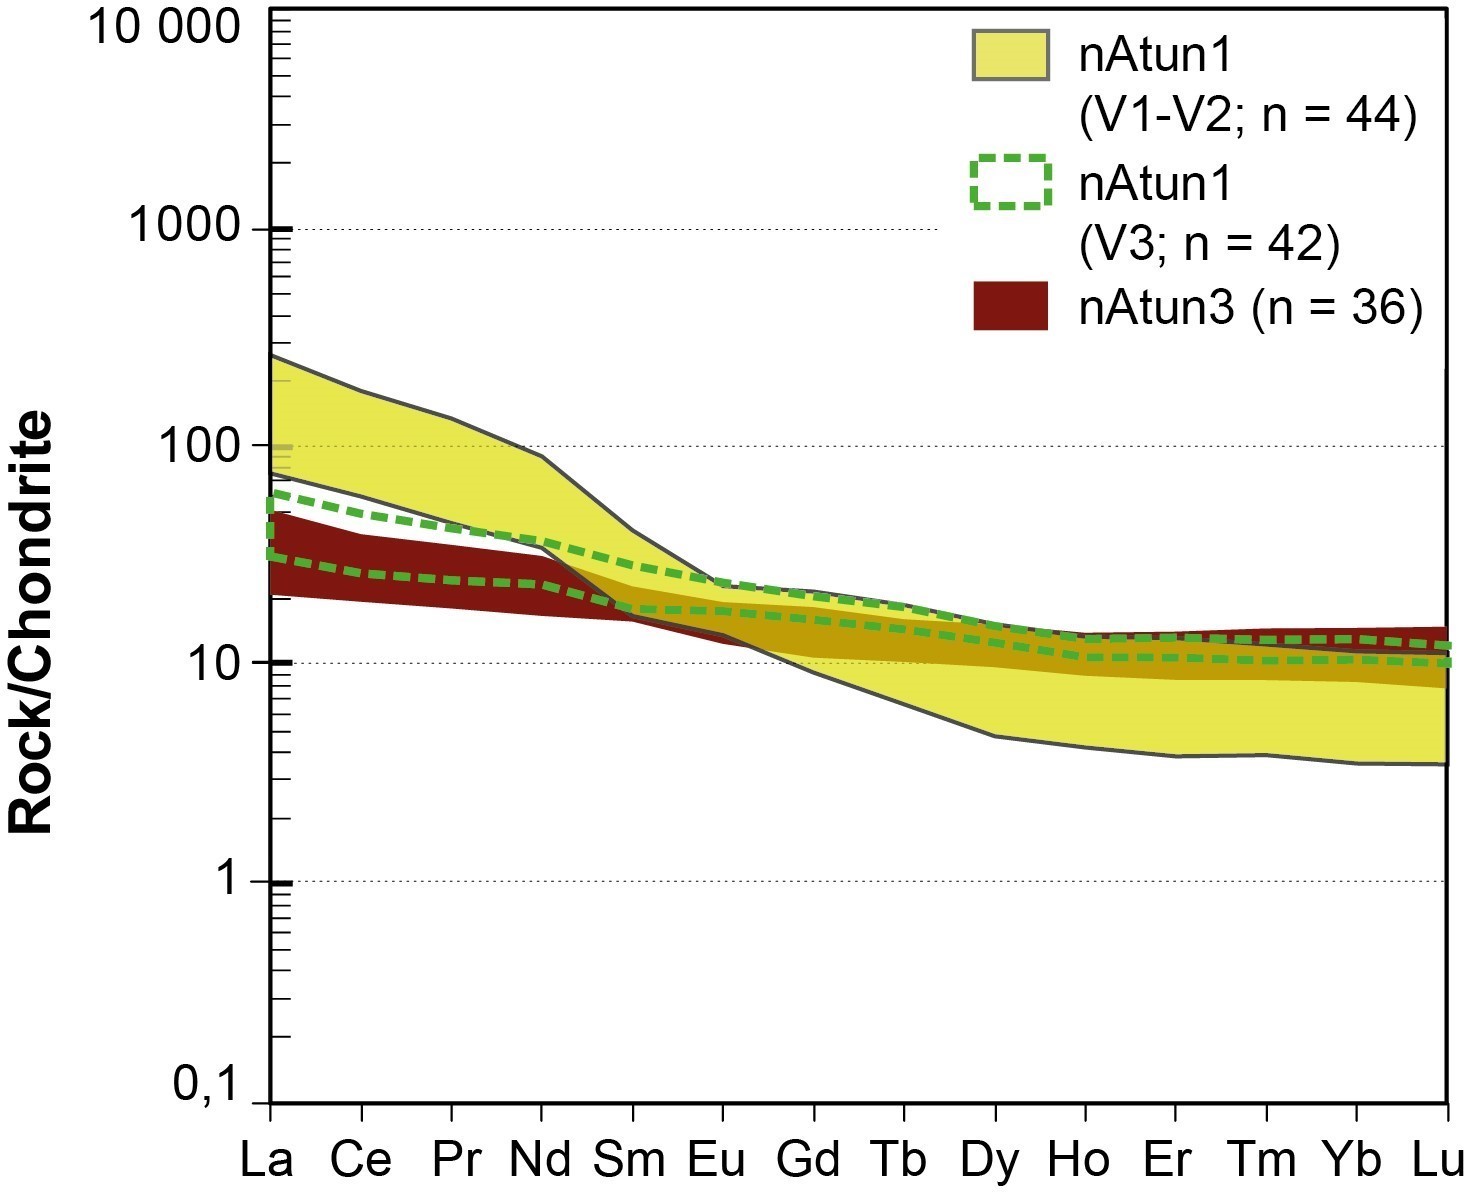
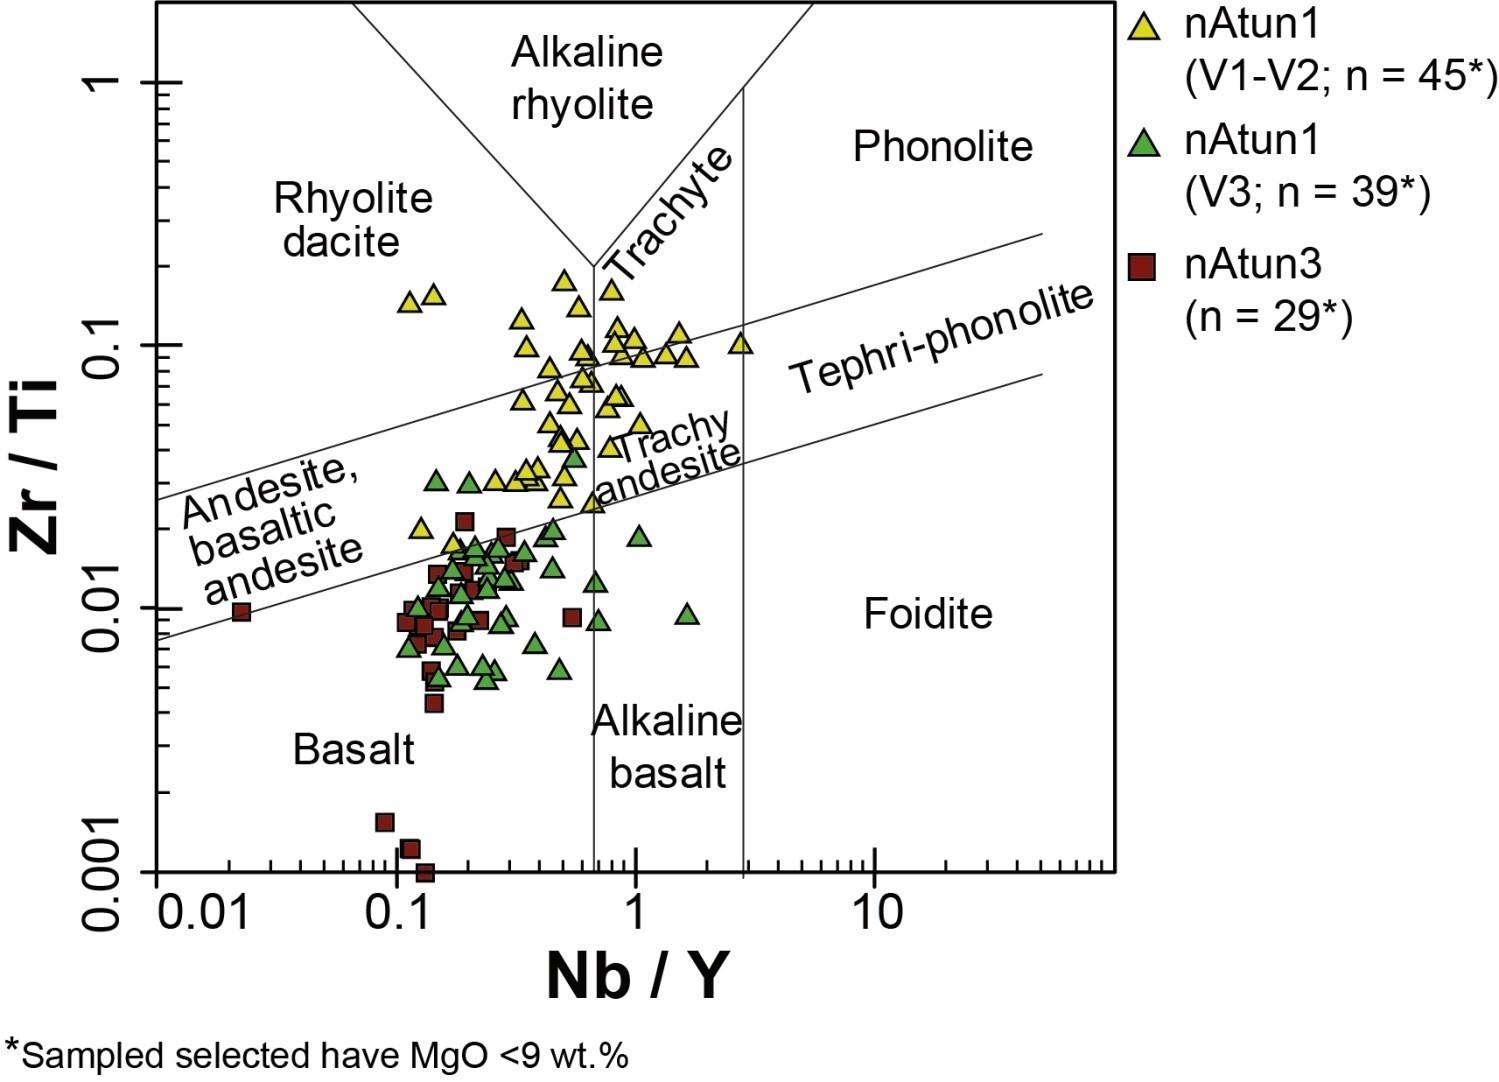
nAtun1 (felsic to intermediate metavolcanics) | Rhyolite/dacite, trachyte, andesite/basaltic andesite and trachyandesite (Diagram) | Calc-alkaline to K-rich calc-alkaline and shoshonitic (Diagram) | 0.18-0.71 | 21.2 < (La/Yb)N < 22.6 4.5 < (La/Sm)N < 6.3 1.9 < (Gd/Yb)N < 2.6 0.8 < Eu/Eu* < 1.1 (Diagram) | Negative anomalies in: Ta‑Nb, P, Ti Positive anomalies in: Th (Diagram) | Zr-Hf anomaly absent or slightly negative | |
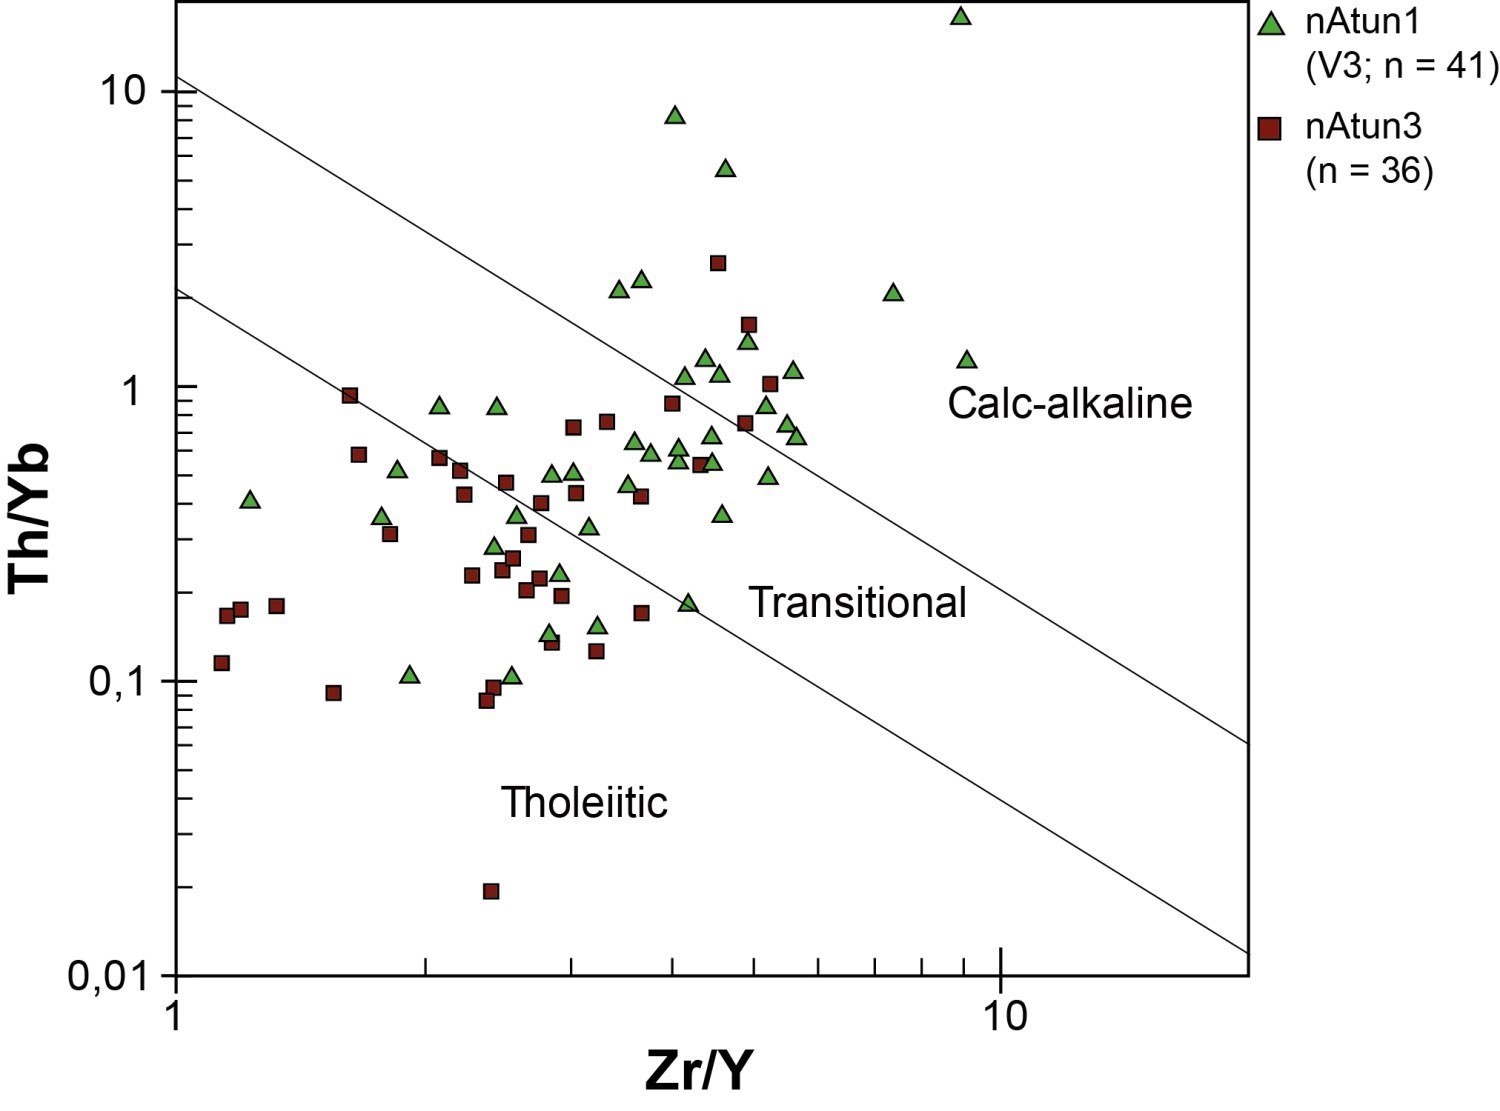
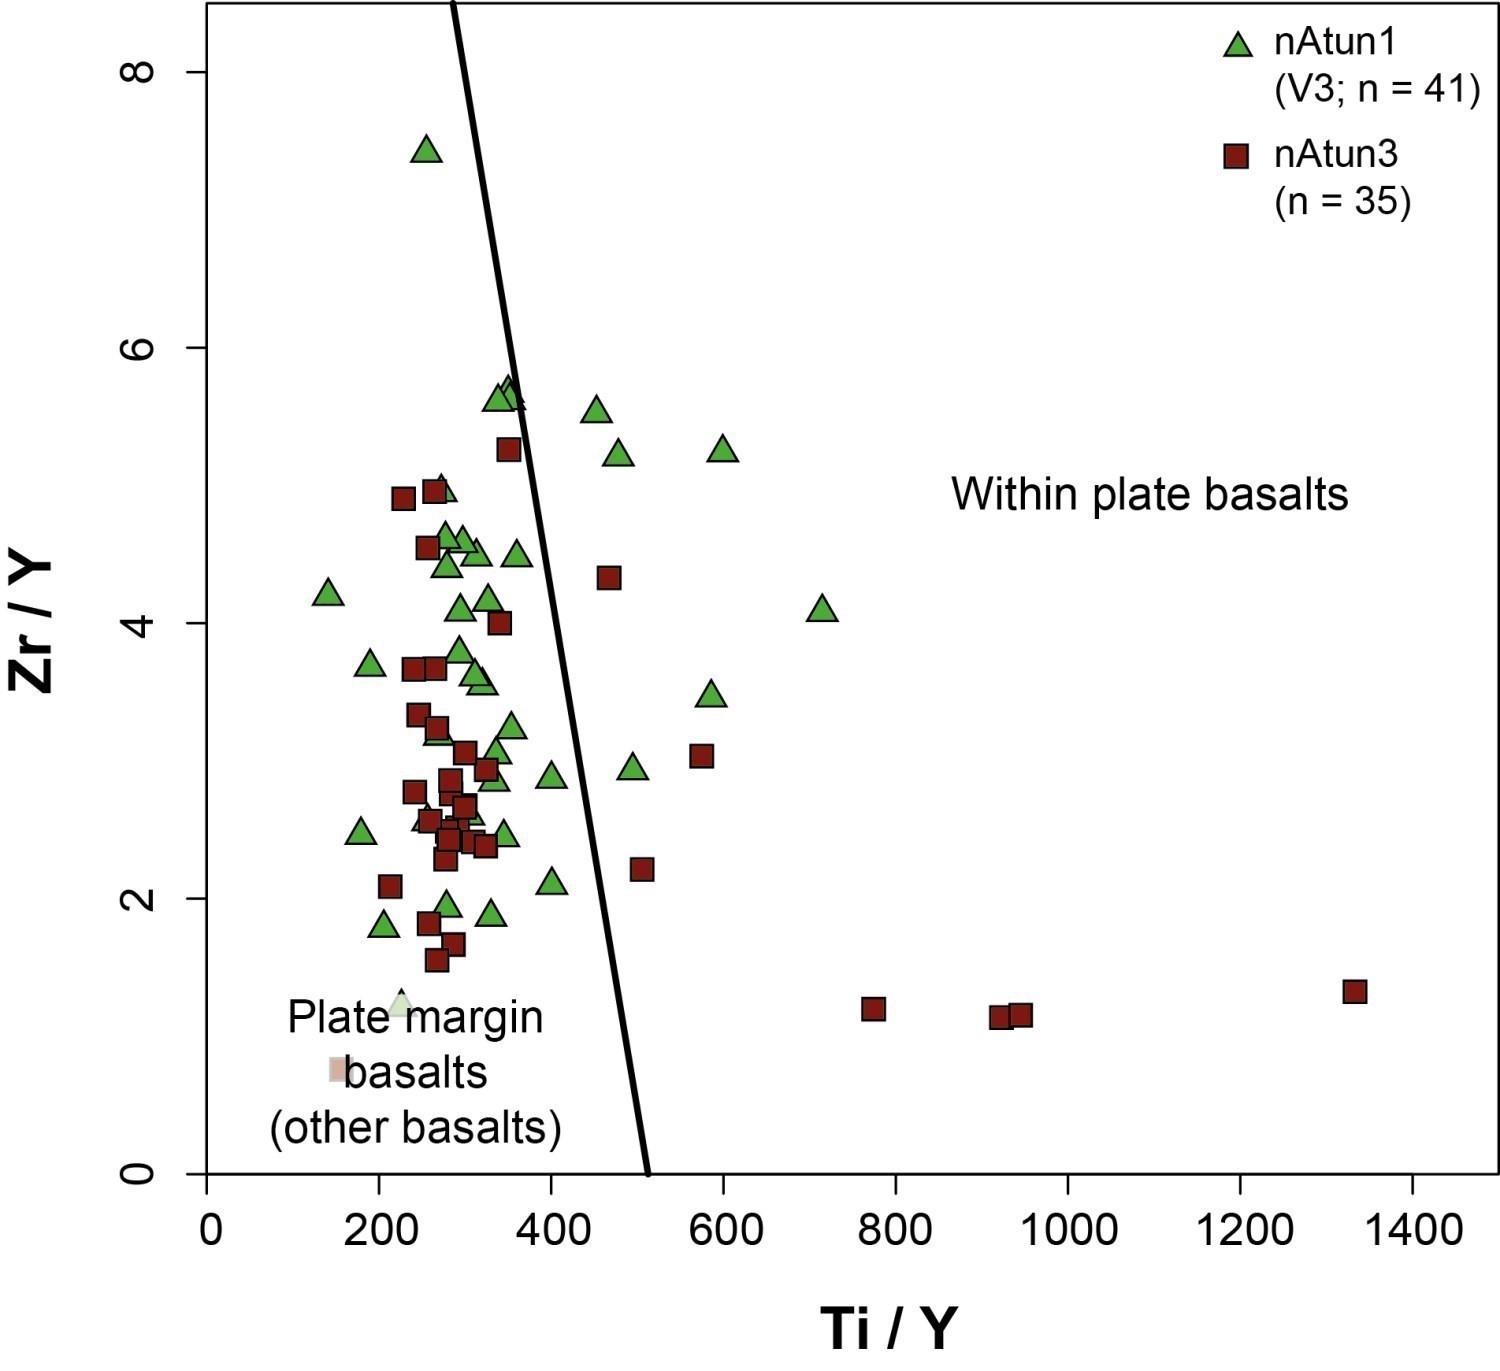
nAtun1 (metabasalt) | Andesite, basaltic andesite and basalt (Diagram) | Tholeiitic to calc-alkaline (Diagram) (Diagram) | Plate margin basalt (Diagram) Calc-alkaline volcanic arc basalt (Diagram) | 0.25-0.73 | 3.0 < (La/Yb)N < 6.5 1.7 < (La/Sm)N < 3.0 (Gd/Yb)N ≈ 1.5 0.9 < Eu/Eu* < 1.0 (Diagram) | Negative anomalies in: Th; Ta‑Nb, P, Zr‑Hf (Diagram) | Ti anomaly absent or slightly positive |
nAtun3 | Gabbro (Diagram) | Tholeiitic to calc-alkaline (Diagram) (Diagram) | Plate margin basalt (Diagram) Calc-alkaline volcanic arc basalt, N‑MORB and E‑MORB (Diagram) | 0.27-0.78 | 2.5 < (La/Yb)N < 3.5 1.3 < (La/Sm)N < 2.2 1.2 < (Gd/Yb)N < 1.3 0.9 < Eu/Eu* < 1.0 (Diagram) | Negative anomalies in: Th, Ta‑Nb, P, Zr‑Hf (Diagram) | REE and spider diagrams similar to unit pPtun1 mafic samples, but more primitive |
Sedimentary Rocks | |||||||
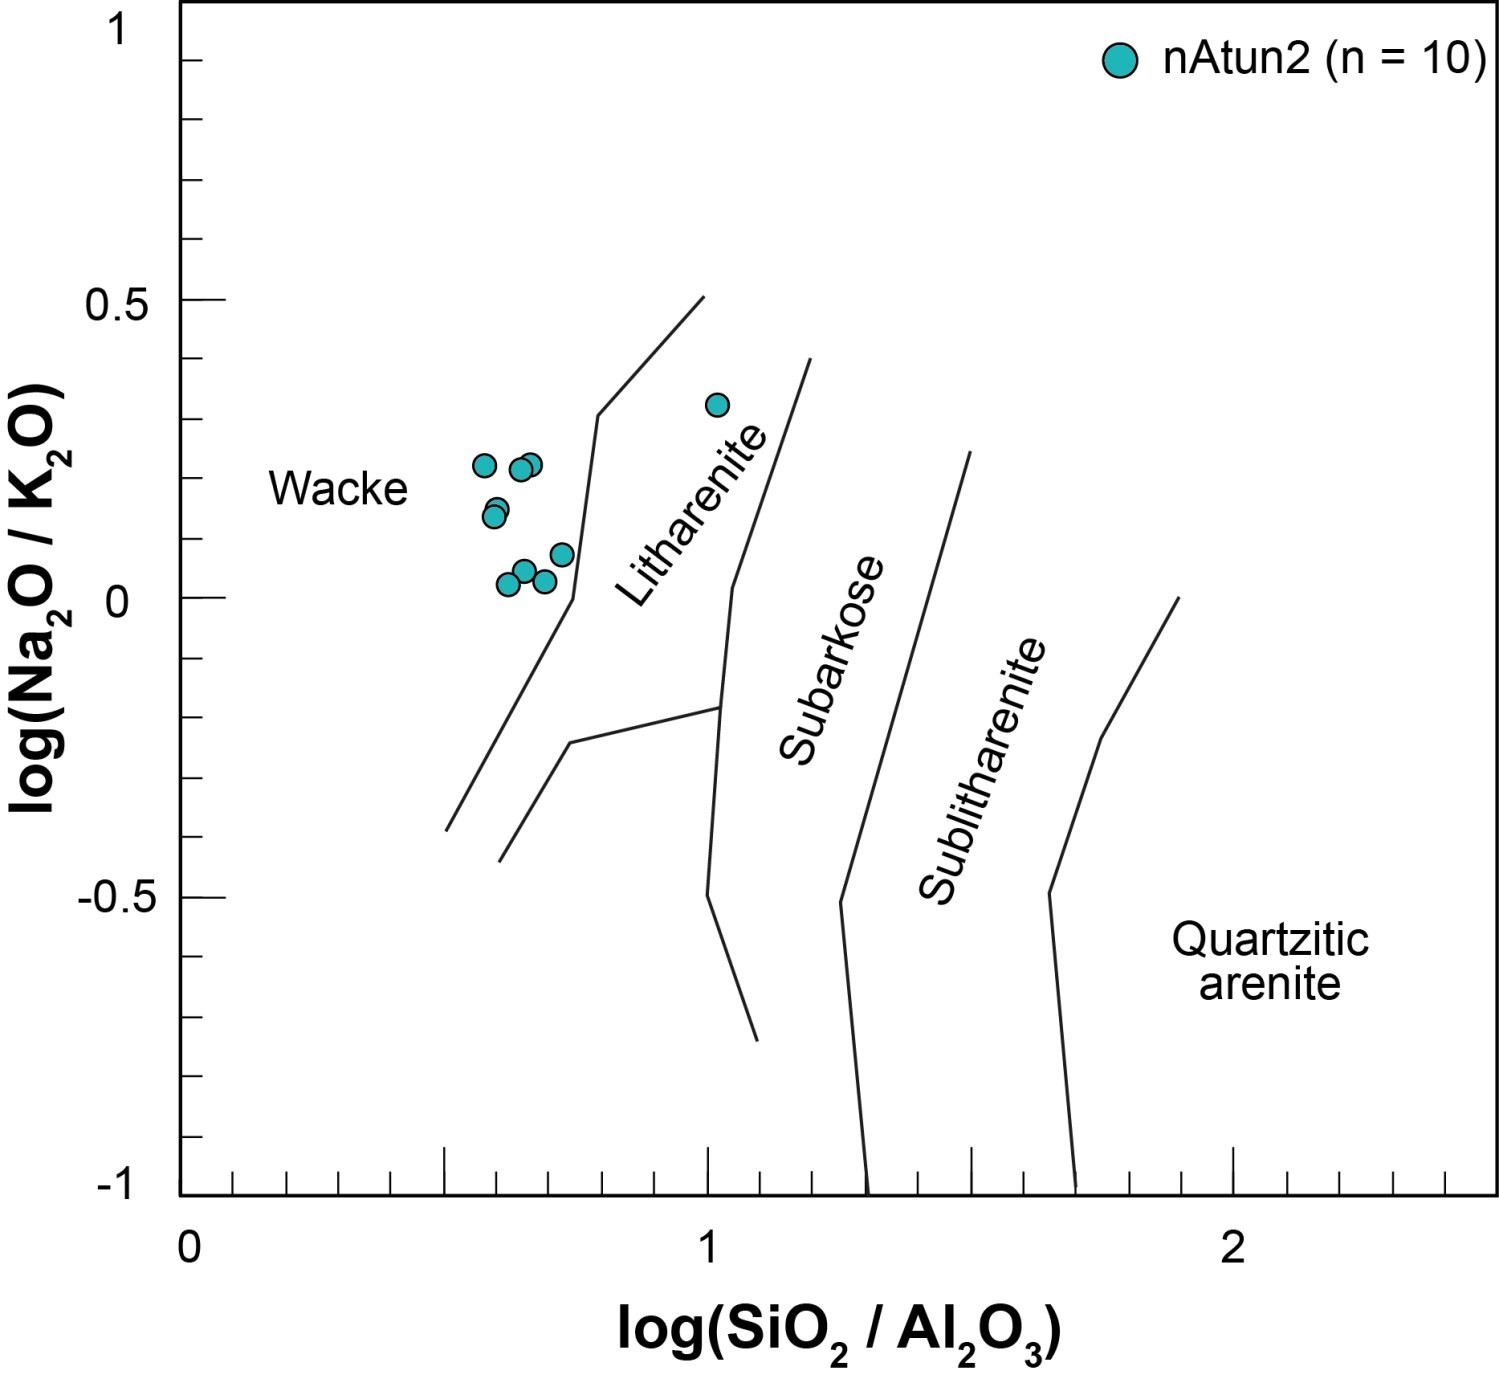
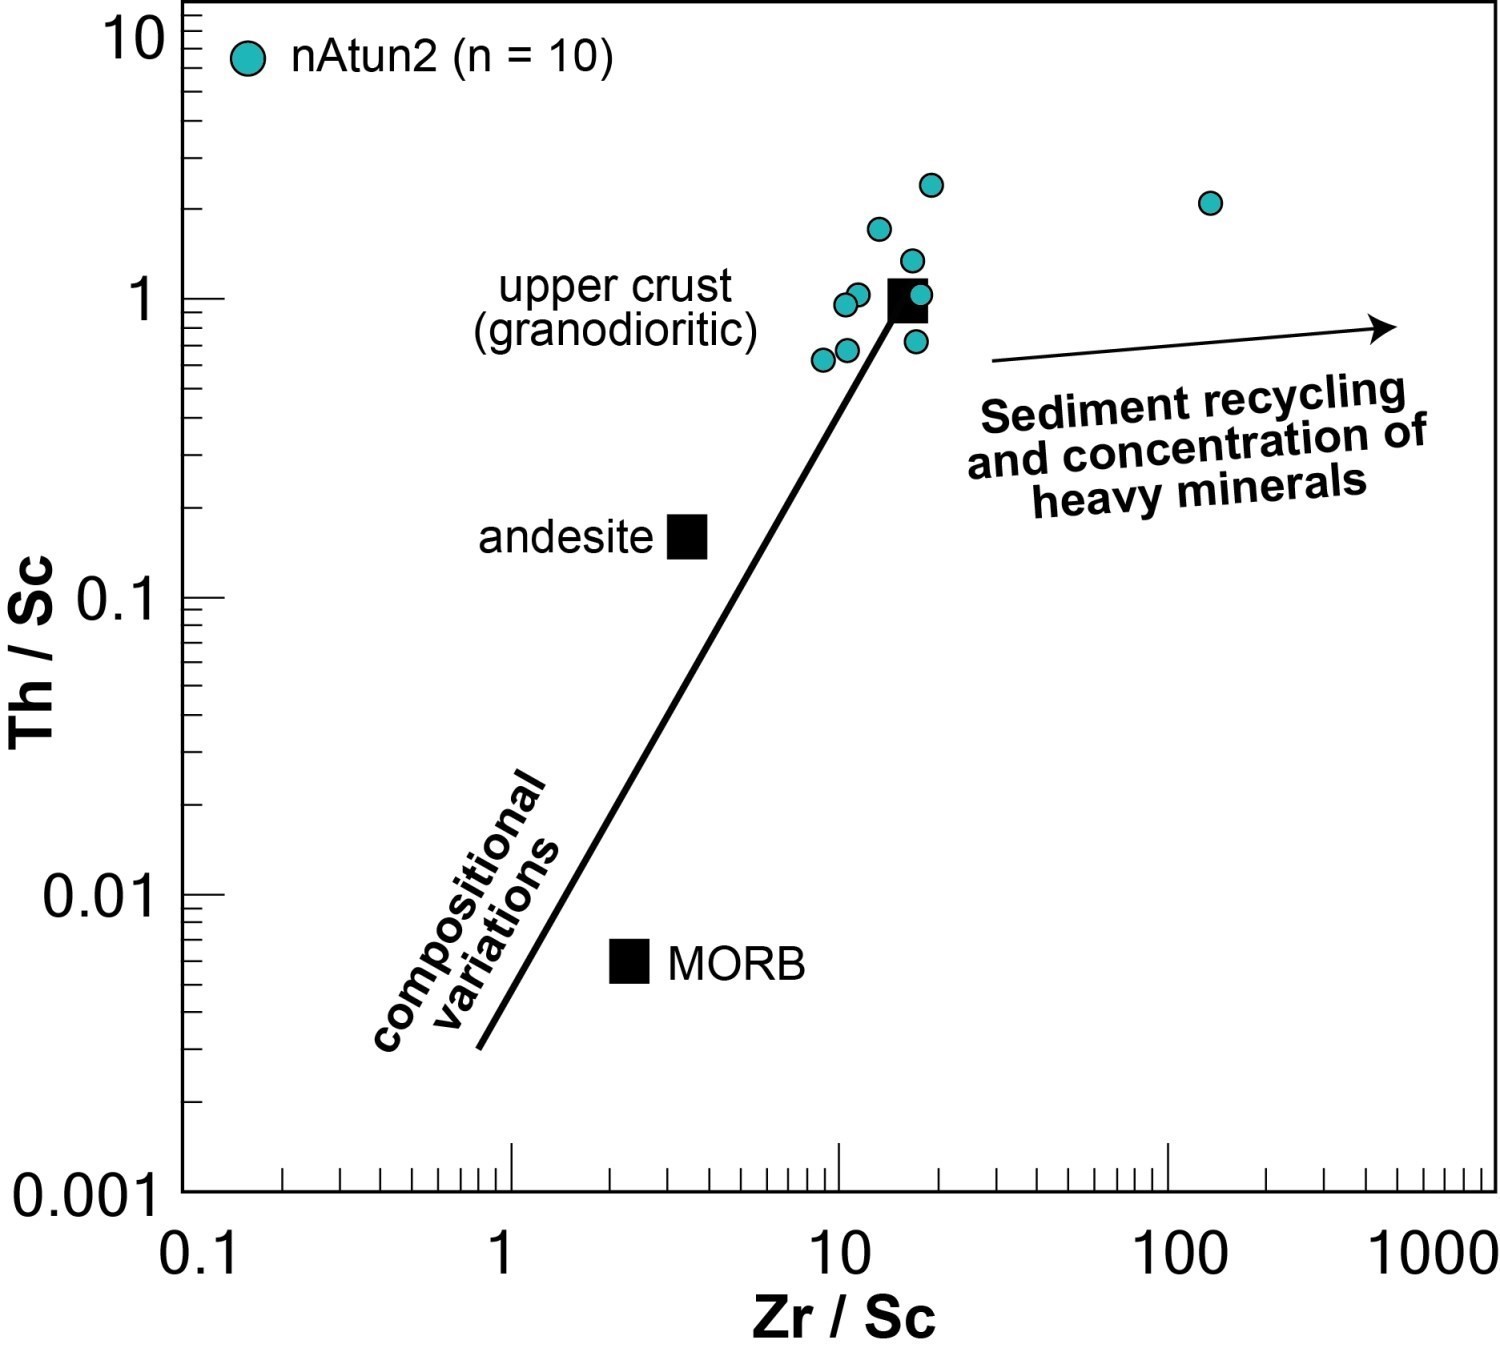
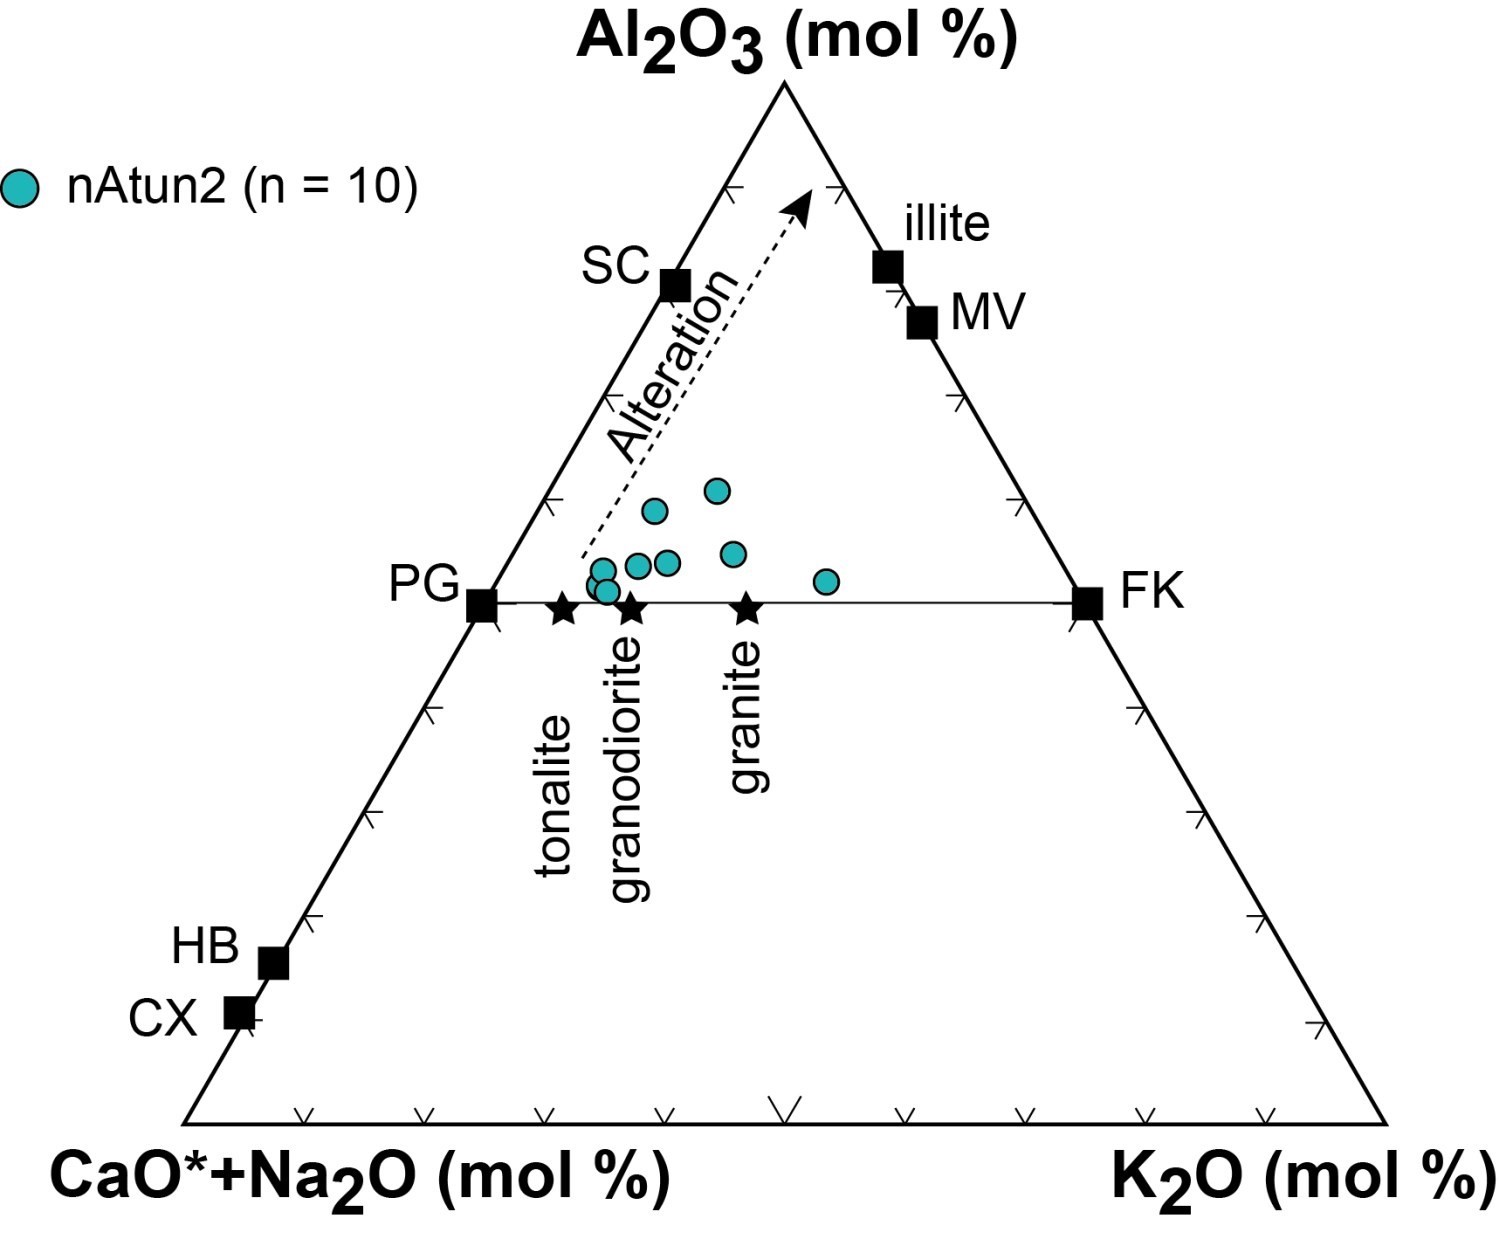
nAtun2 | Metawacke (Diagram) | Sedimentary rocks derived from the upper crust (granodioritic to granitic), unrecycled and slightly altered (Diagram) (Diagram) | 0.28-0.49 | ||||
Trace elements of metabasalt and metagabbro samples from the Tunulic Complex (nAtun1 and nAtun3, respectively) suggest a tholeiitic to calc-alkaline arc setting with varying crustal contamination. Paragneiss (nAtun2) of this complex appear to be derived from a felsic protolith (granodioritic to granitic upper crust) and to have undergone low transport or recycling. Extended spider diagrams indicate an increase in Th content (crustal contamination) within the intermediate to felsic metavolcanic and metabasalt unit (nAtun1). The latter also have a negative Ti anomaly, whereas this element is non-anomalous or has a small positive anomaly in metabasalt and metagabbro, possibly suggesting the accumulation of Ti oxides in these samples.
Intrusive Rocks
Stratigraphic or Lithodemic Unit | Classification/Rock Type | Affinity | Tectonic Setting | Mg# | Rare Earth Elements | Spider Diagram | Comments |
|---|---|---|---|---|---|---|---|
Felsic and Intermediate Intrusive Rocks | |||||||
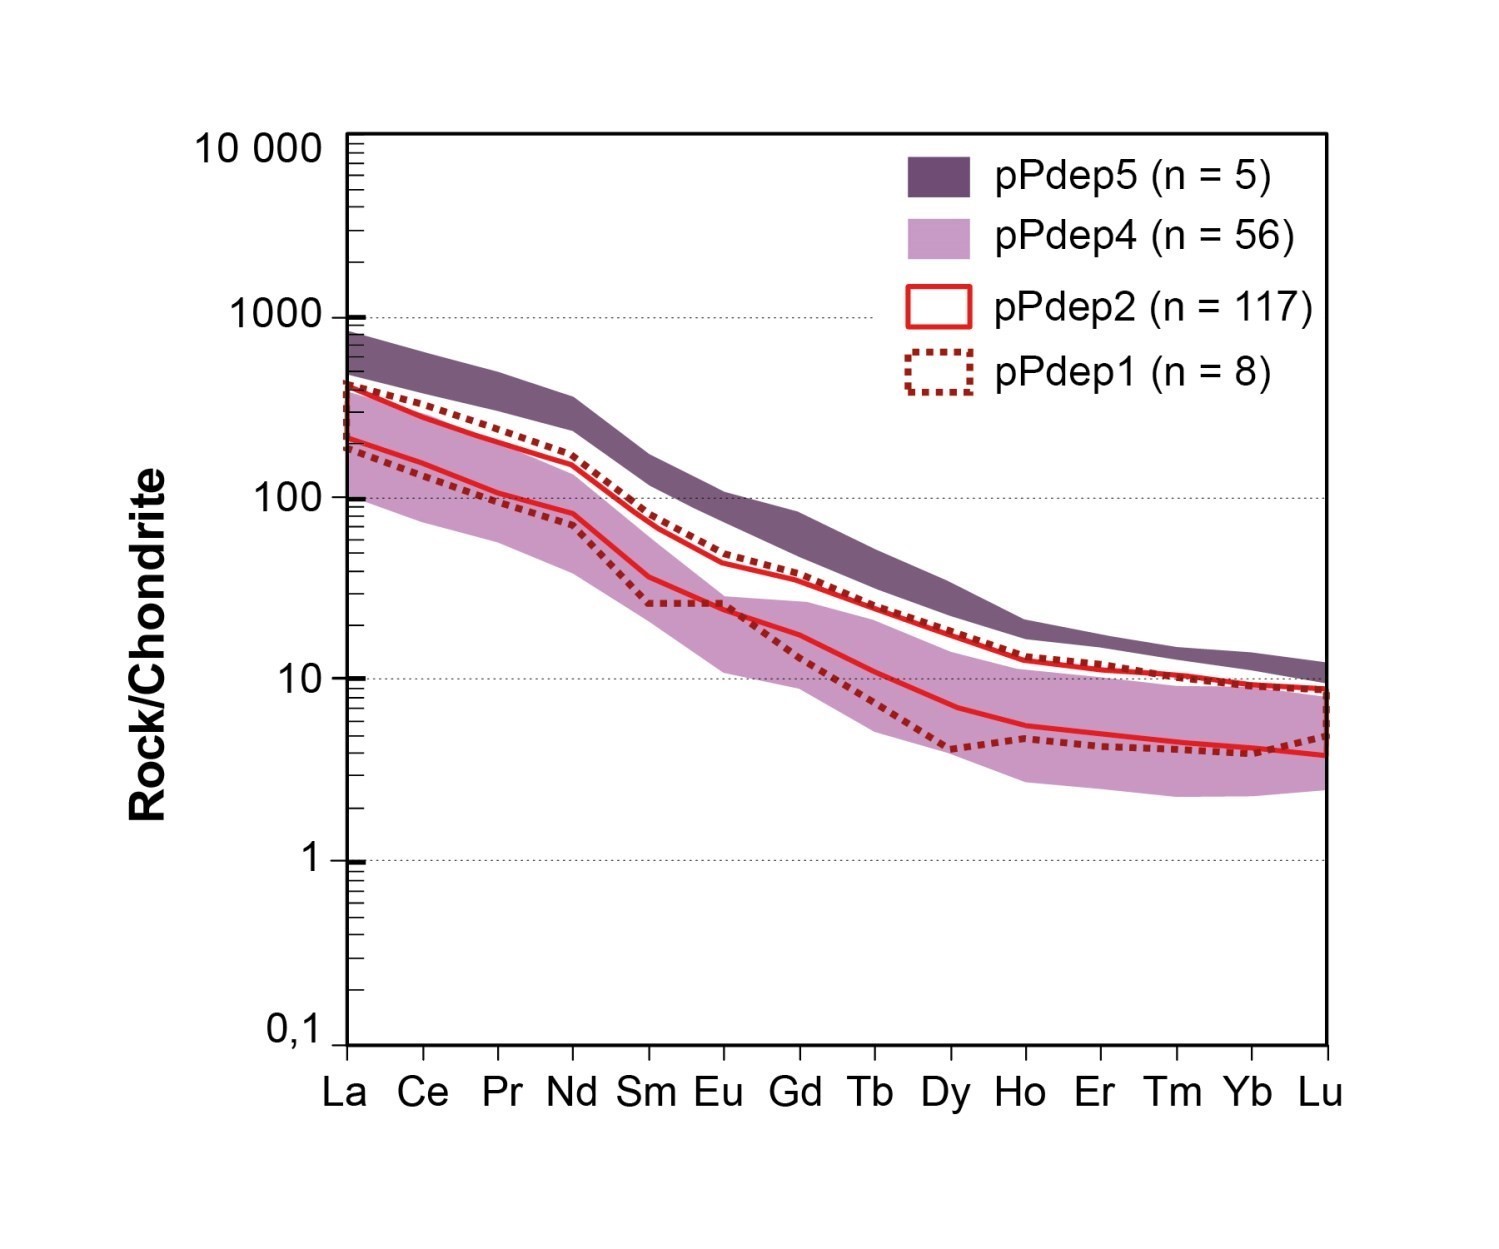
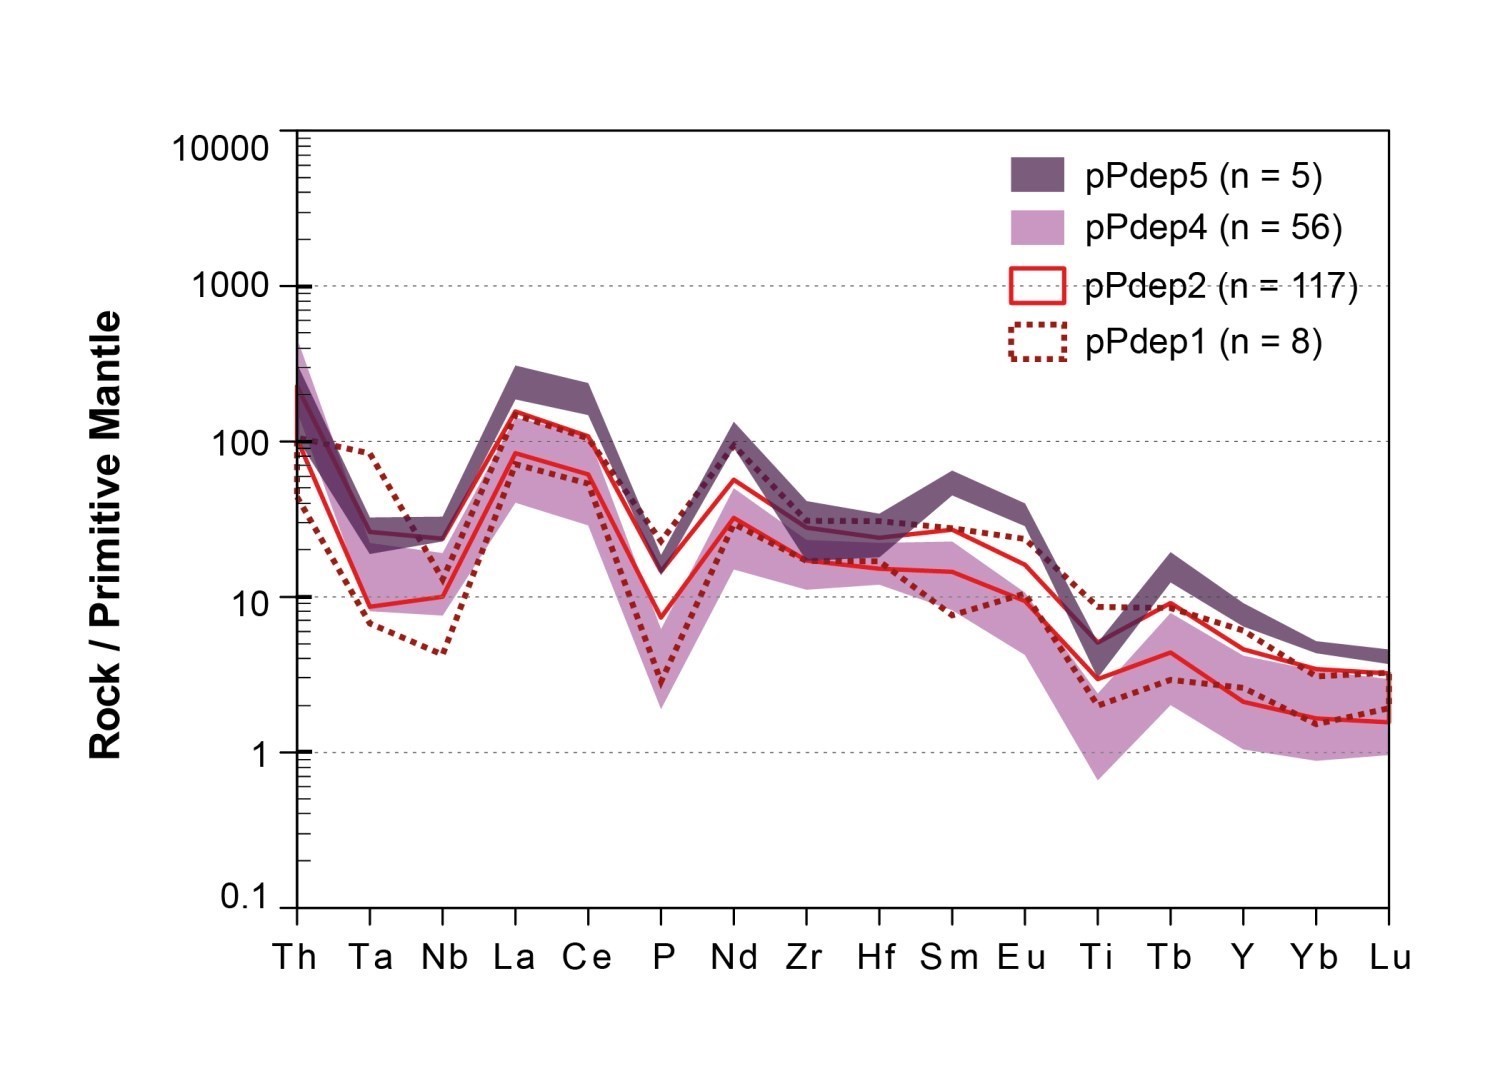
pPdep1 | Tonalite, quartz diorite and quartz monzodiorite (Diagram) | 0.31-0.43 | 46.5 < (La/Yb)N < 47.6 5.4 < (La/Sm)N < 9.4 3.4 < (Gd/Yb)N < 3.9 1.3 < Eu/Eu* < 1.7 (Diagram) | Negative anomalies in: (Ta)‑Nb, P, Zr‑Hf, Sm, Ti Positive anomalies in: Th, (Ta), (Lu) (Diagram) | Slopes (La/Yb)N similar between all pPdep units | ||
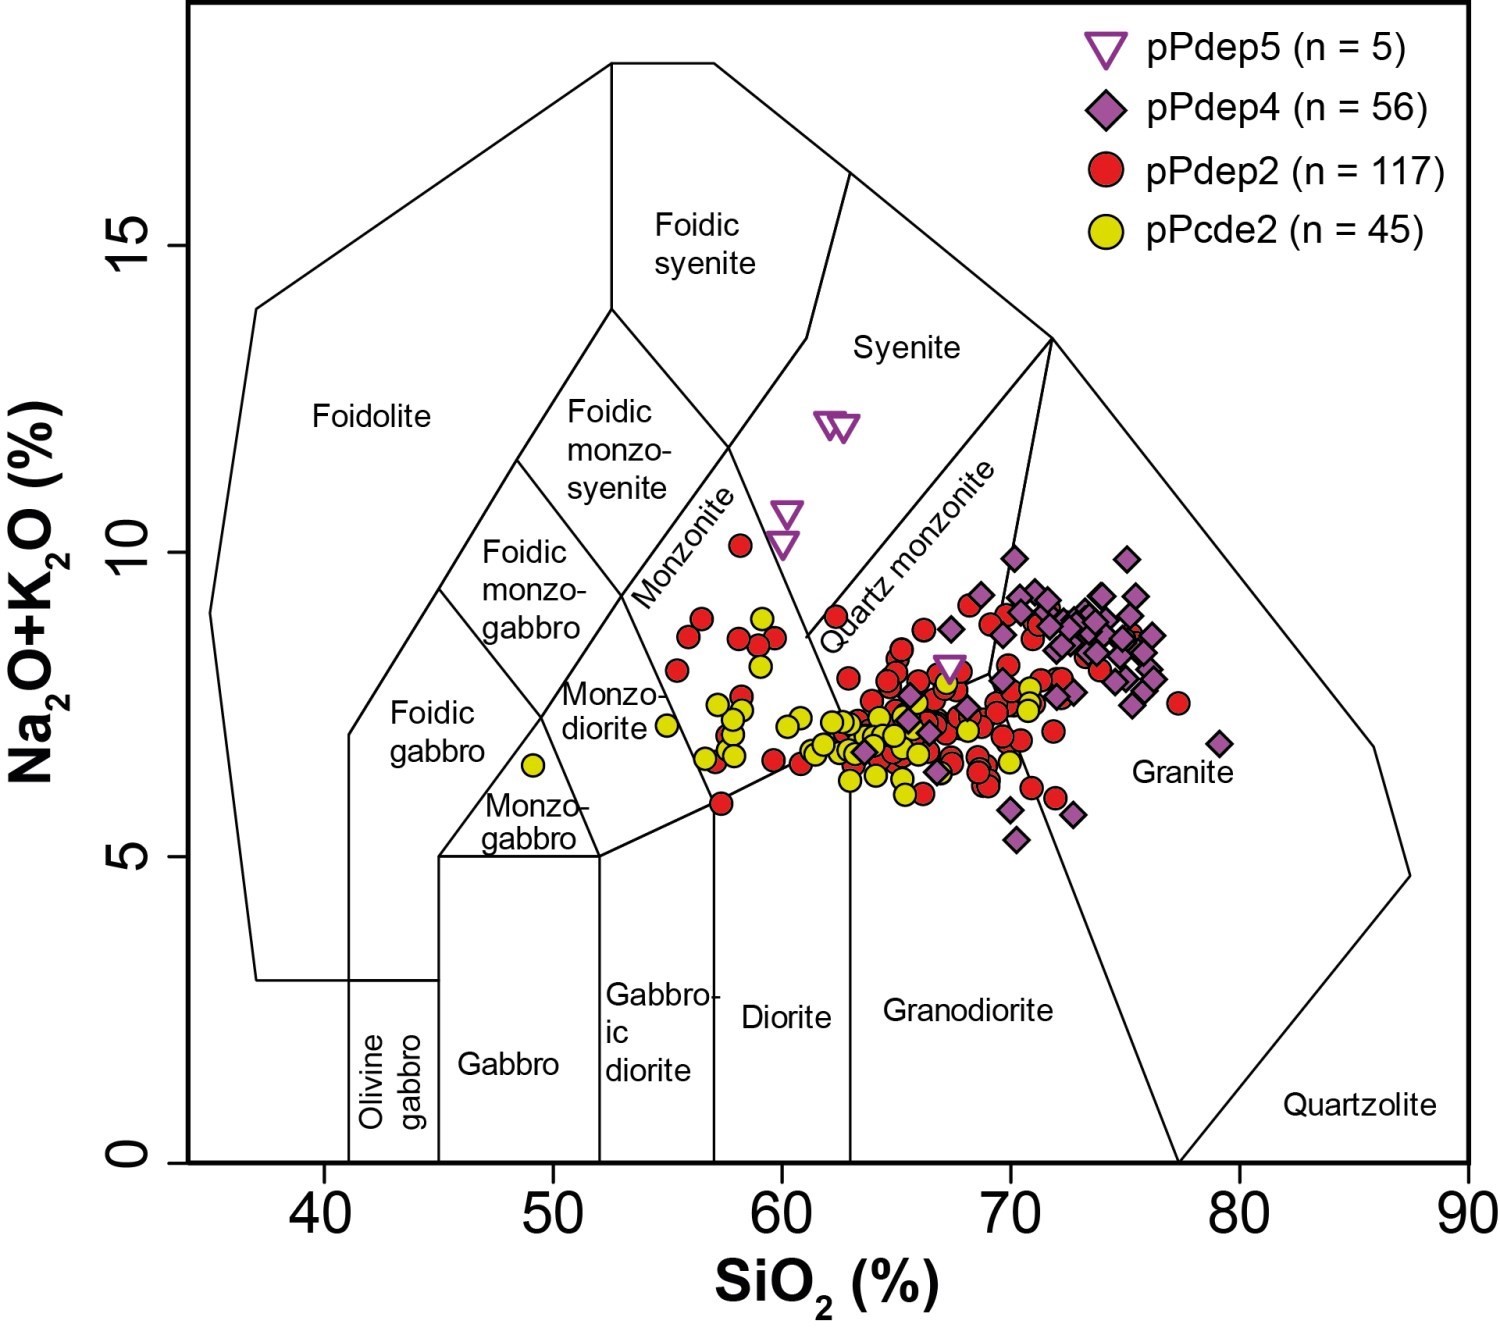
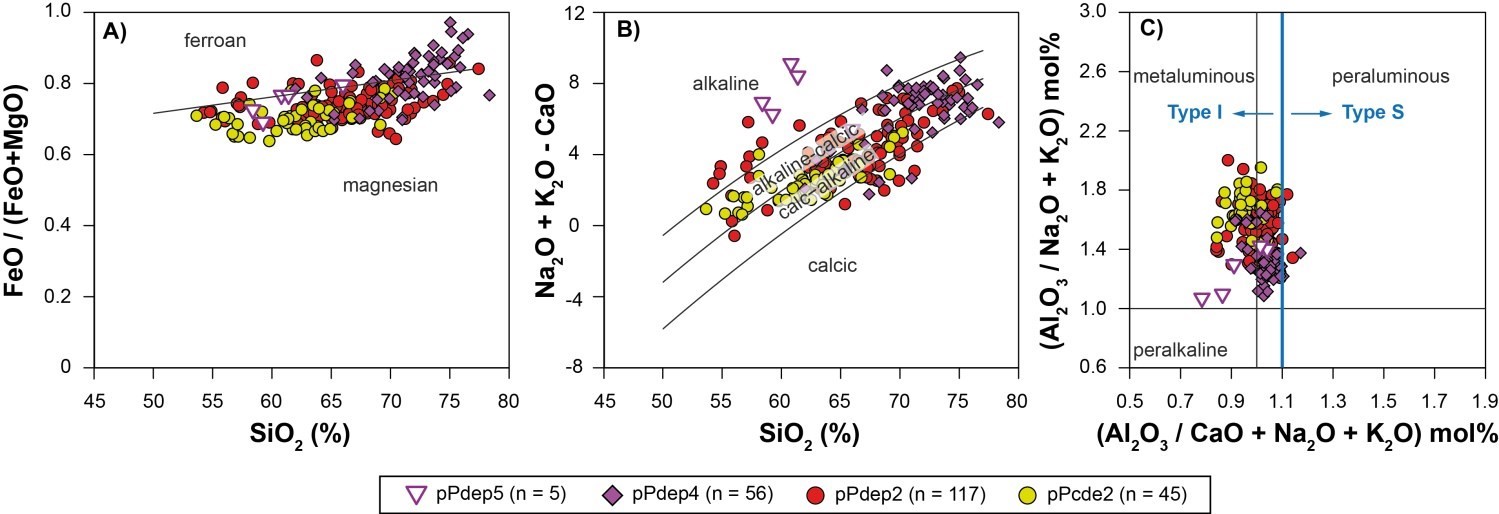
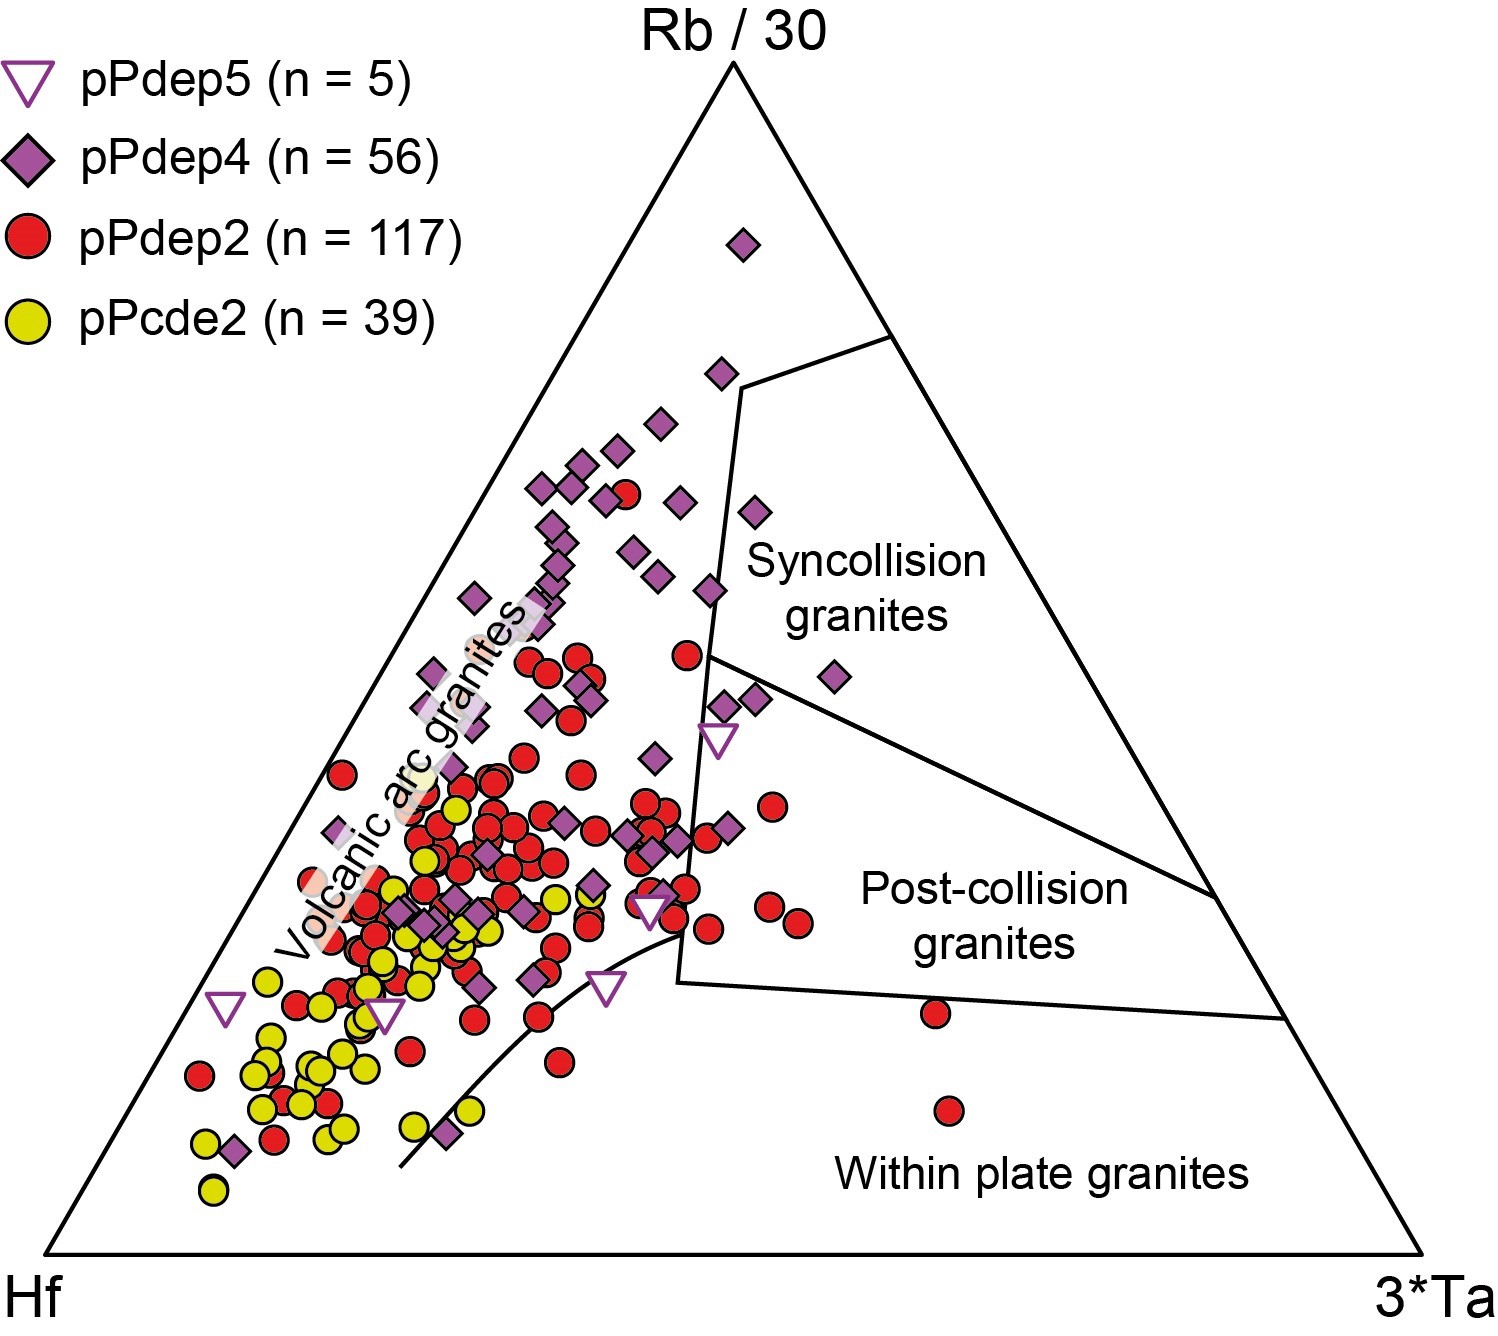
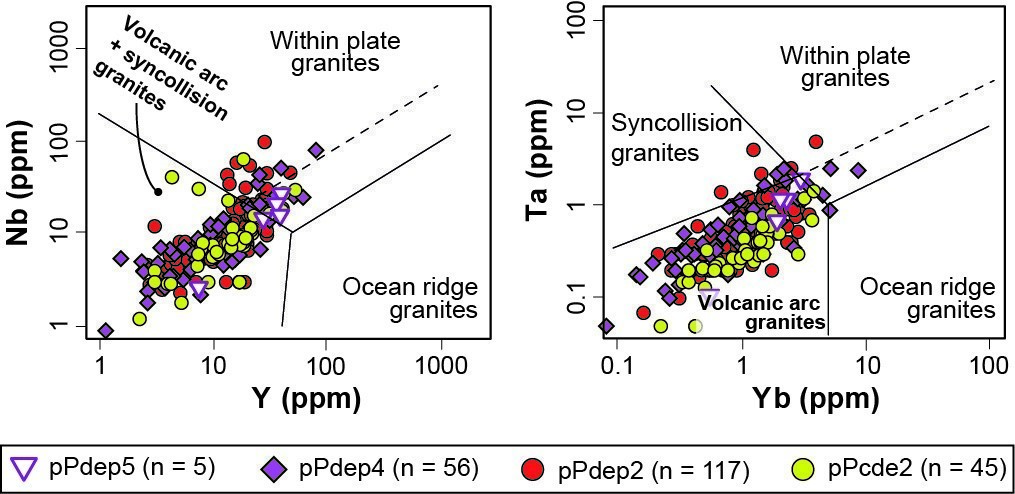
pPdep2 (including subunits) | Granite, granodiorite, quartz monzonite and monzonite (Diagram) | Magnesian granitoid, calc-alkaline to alkaline-calcic and metaluminous to peraluminous (Diagrams) | Volcanic arc granite (Diagram) (Diagram) | 0.22-0.50 | 44.9 < (La/Yb)N < 50.3 (La/Sm)N ≈ 5.8 3.8 < (Gd/Yb)N < 4.1 0.9 ≈ Eu/Eu* (Diagram) | Negative anomalies in:Ta‑Nb, P, Zr‑Hf, Ti Positive anomalies in: Th (Diagram) | |
pPdep4 | Granite and granodiorite (Diagram) | Magnesian and ferriferous granitoids, calc-alkaline to alkaline-calcic and generally peraluminous (Diagrams) | Volcanic arc granite (Diagram) (Diagram) | 0.09-0.44 | 42.0 < (La/Yb)N < 45.2 4.9 < (La/Sm)N < 6.3 3.0 < (Gd/Yb)N < 3.9 0.7 < Eu/Eu* < 0.8 (Diagram) | Negative anomalies in: Ta‑Nb, P, Zr‑Hf, Ti Positive anomalies in: Th (Diagram) | Only De Pas unit containing ferriferous granitoids |
pPdep5 | Syenite and quartz monzonite (Diagram) | Magnesian granitoid, alkaline and metaluminous to peraluminous (Diagrams) | Volcanic arc granite (Diagram) (Diagram) | 0.31-0.44 | 42.4 < (La/Yb)N < 58.6 4.2 < (La/Sm)N < 4.8 4.2 < (Gd/Yb)N < 5.9 0.9 < Eu/Eu* < 1.0 (Diagram) | Negative anomalies in: Ta‑Nb, P, Zr‑Hf, Ti Positive anomalies in: Th (Diagram) | |
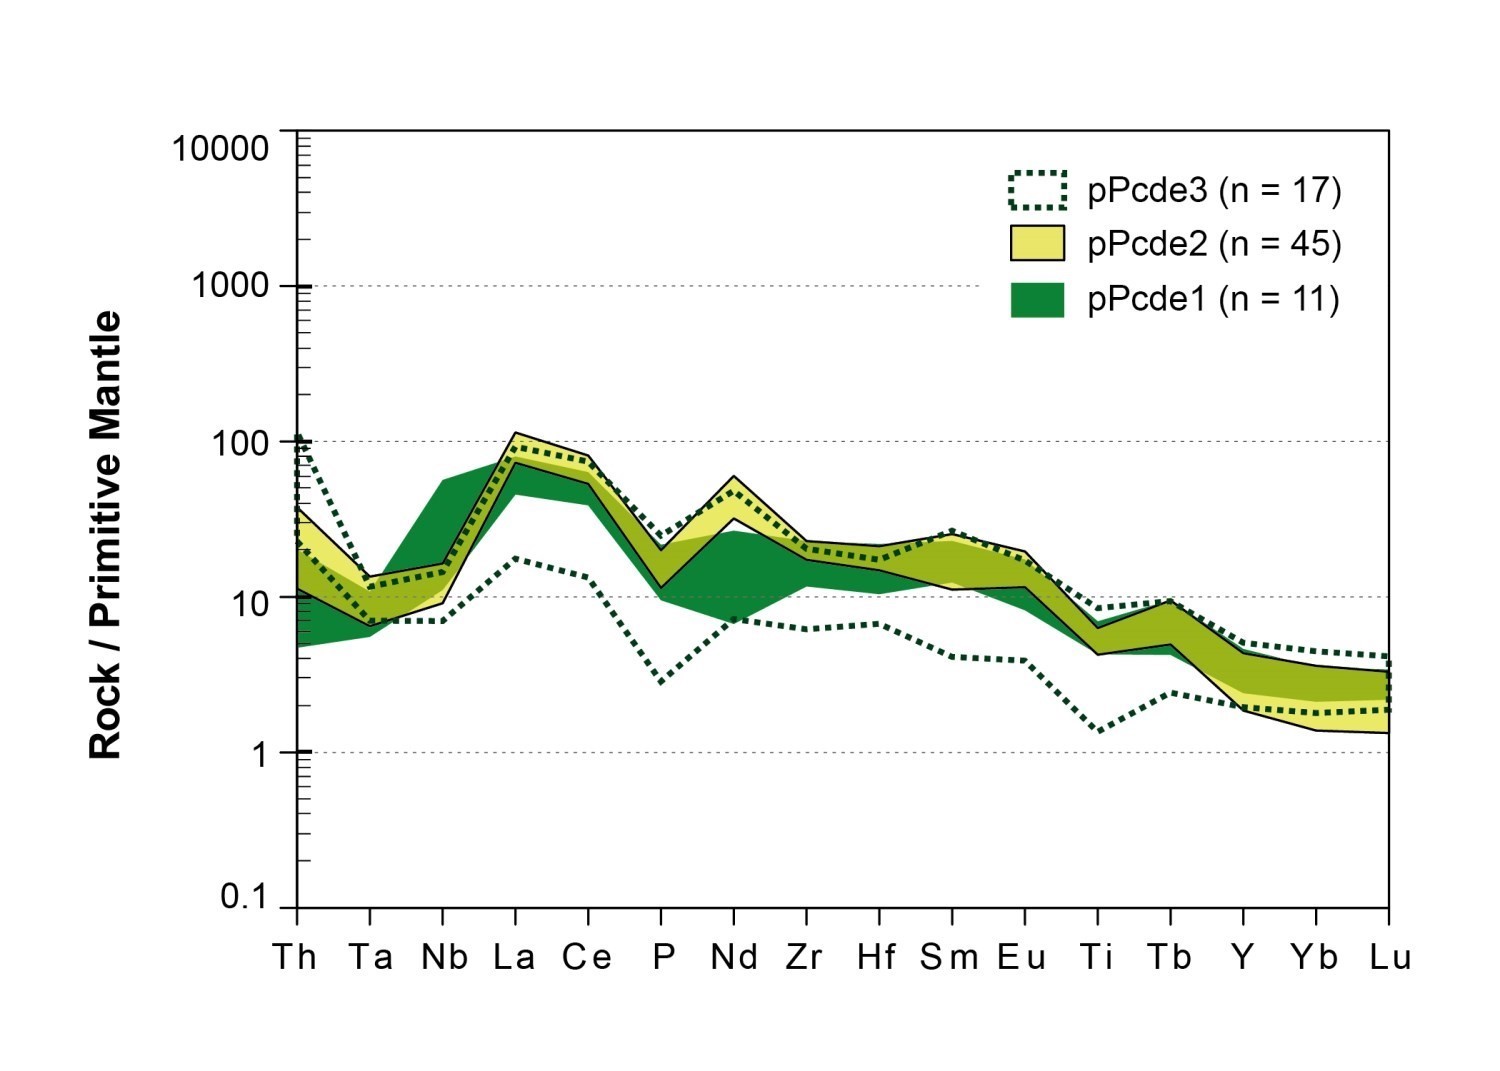
pPcde1 | Tonalite, quartz diorite, quartz monzodiorite and diorite/gabbro (Diagram) | 0.37-0.55 | 21.3 < (La/Yb)N < 22.3 3.5 < (La/Sm)N < 3.7 2.9 < (Gd/Yb)N < 3.8 0.9 < Eu/Eu* < 1.0 (Diagram) | Negative anomalies in: Th, Ta‑(Nb), P, Nd, Ti Positive anomalies in: (Nb) (Diagram) | |||
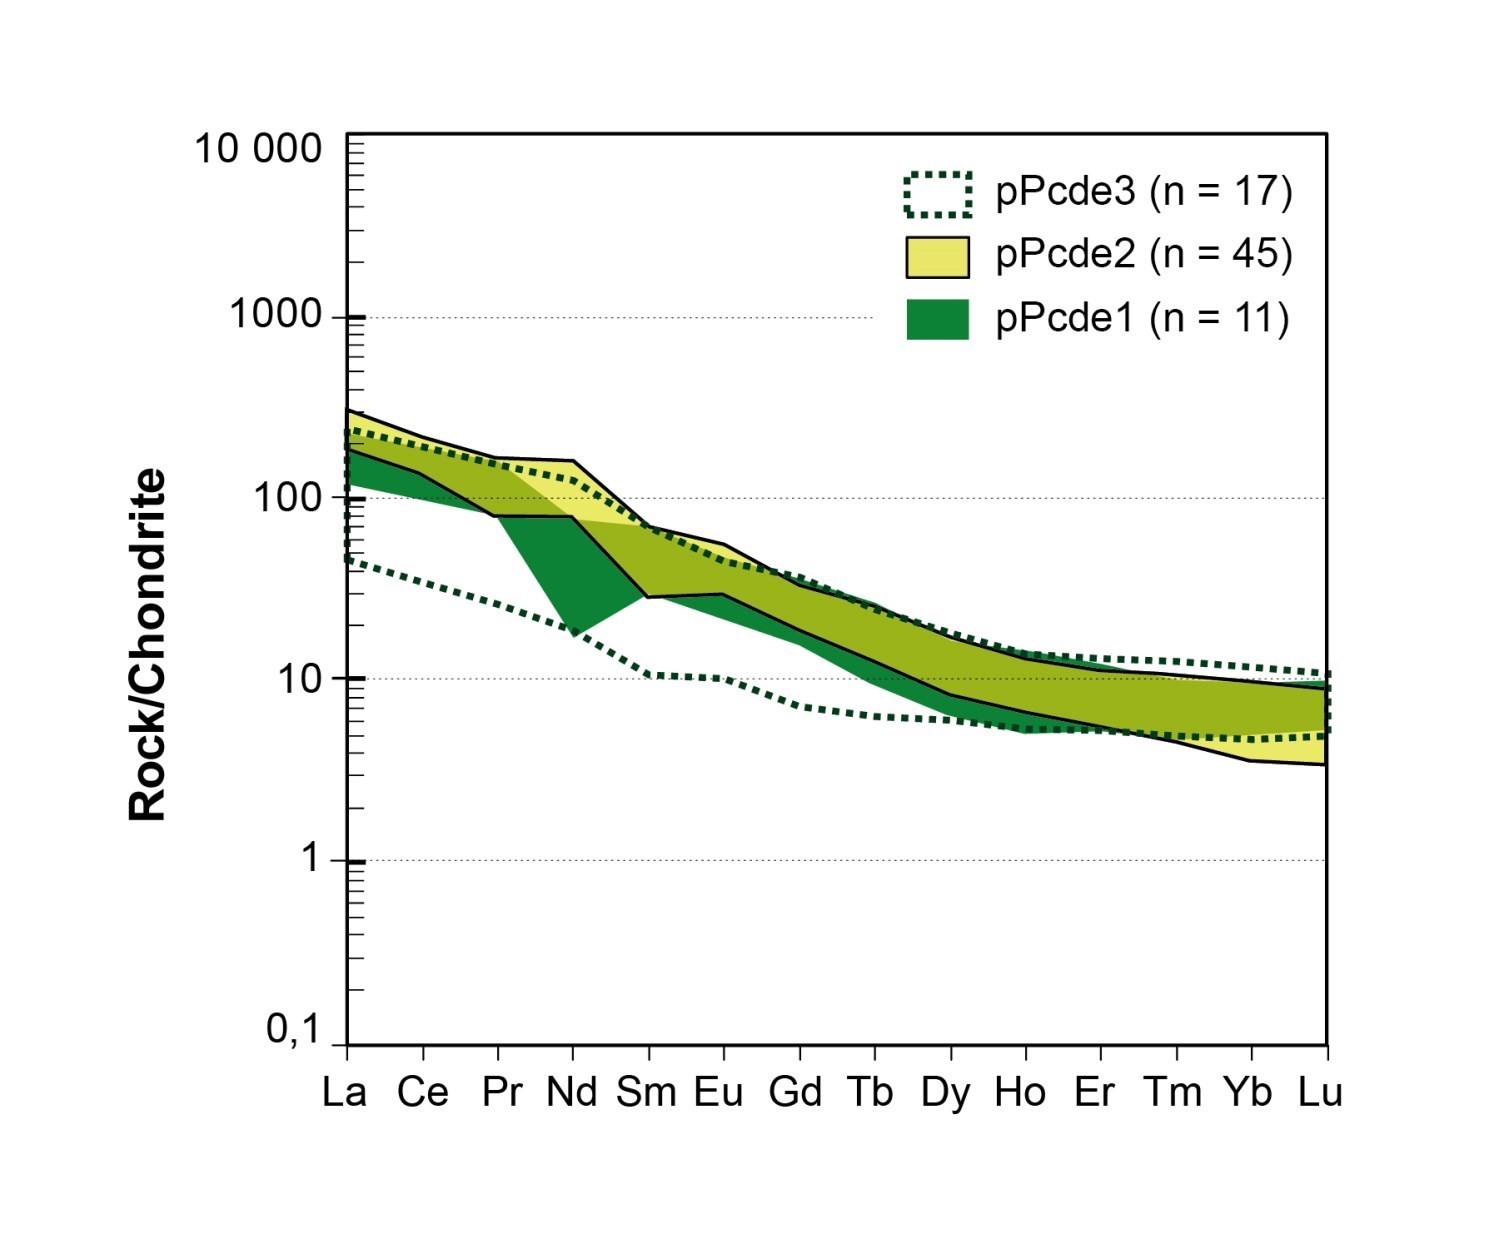
pPcde2 | Granodiorite and monzonite (Diagram) | Magnesian granitoid, calc-alkaline to alkaline-calcic and generally metaluminous (Diagrams) | Volcanic arc granite (Diagram) (Diagram) | 0.33-0.50 | 31.3 < (La/Yb)N < 52.2 4.5 < (La/Sm)N < 6.6 3.4 < (Gd/Yb)N < 5.1 1.1 < Eu/Eu* < 1.3 (Diagram) | Negative anomalies in: Ta‑Nb, P, Zr‑Hf, Sm, Ti Positive anomalies in: Th, Nd (Diagram) | |
pPmer | Quartz diorite to monzogabbro (Diagram) | 0.37-0.58 | |||||
Stratigraphic or Lithodemic Unit | Classification | Affinity | Tectonic Setting | Mg# | Rare Earth Elements | Spider Diagram | Comments |
|---|---|---|---|---|---|---|---|
Mafic and Ultramafic Intrusive Rocks | |||||||
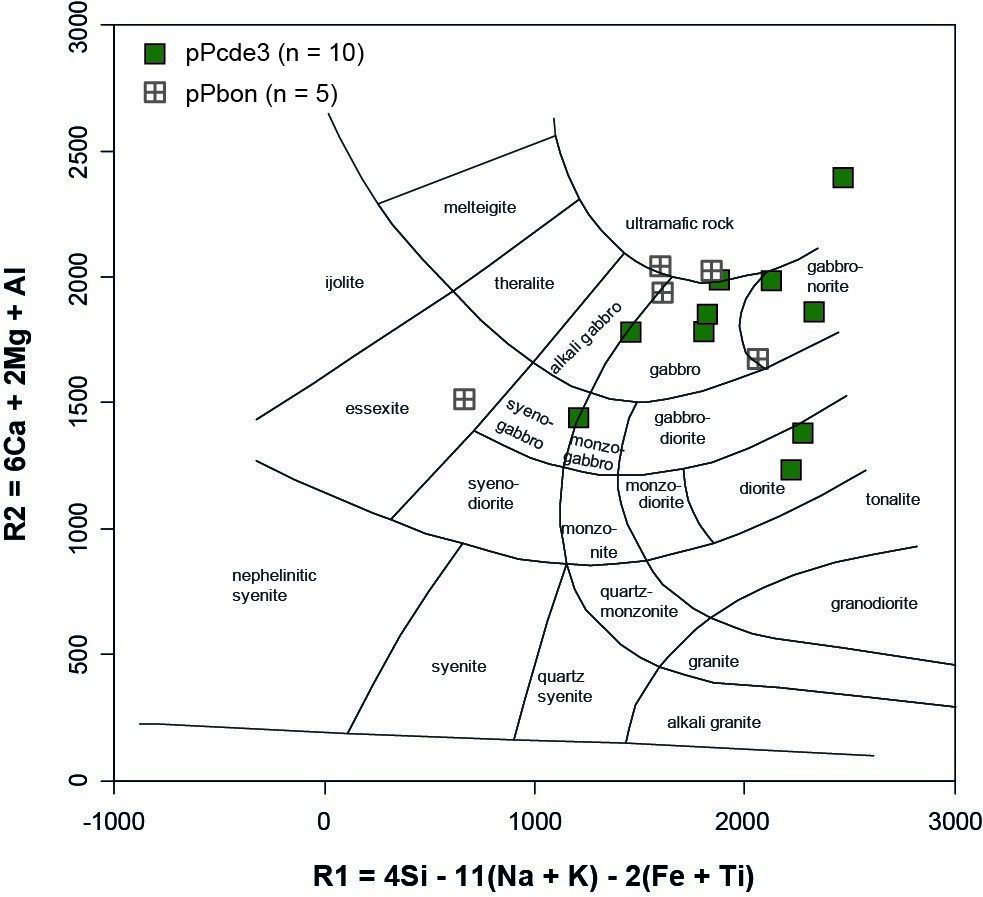
pPcde3 | Gabbro, gabbronorite, diorite and monzogabbro (Diagram) | 0.39-0.71 | 9.7 < (La/Yb)N < 20.4 3.5 < (La/Sm)N < 4.3 1.5 < (Gd/Yb)N < 3.1 0.9 < Eu/Eu* < 1.2 (Diagram) | Negative anomalies in: Ta‑Nb, P, Zr‑Hf, Ti Positive anomalies in: Th (Diagram) | |||
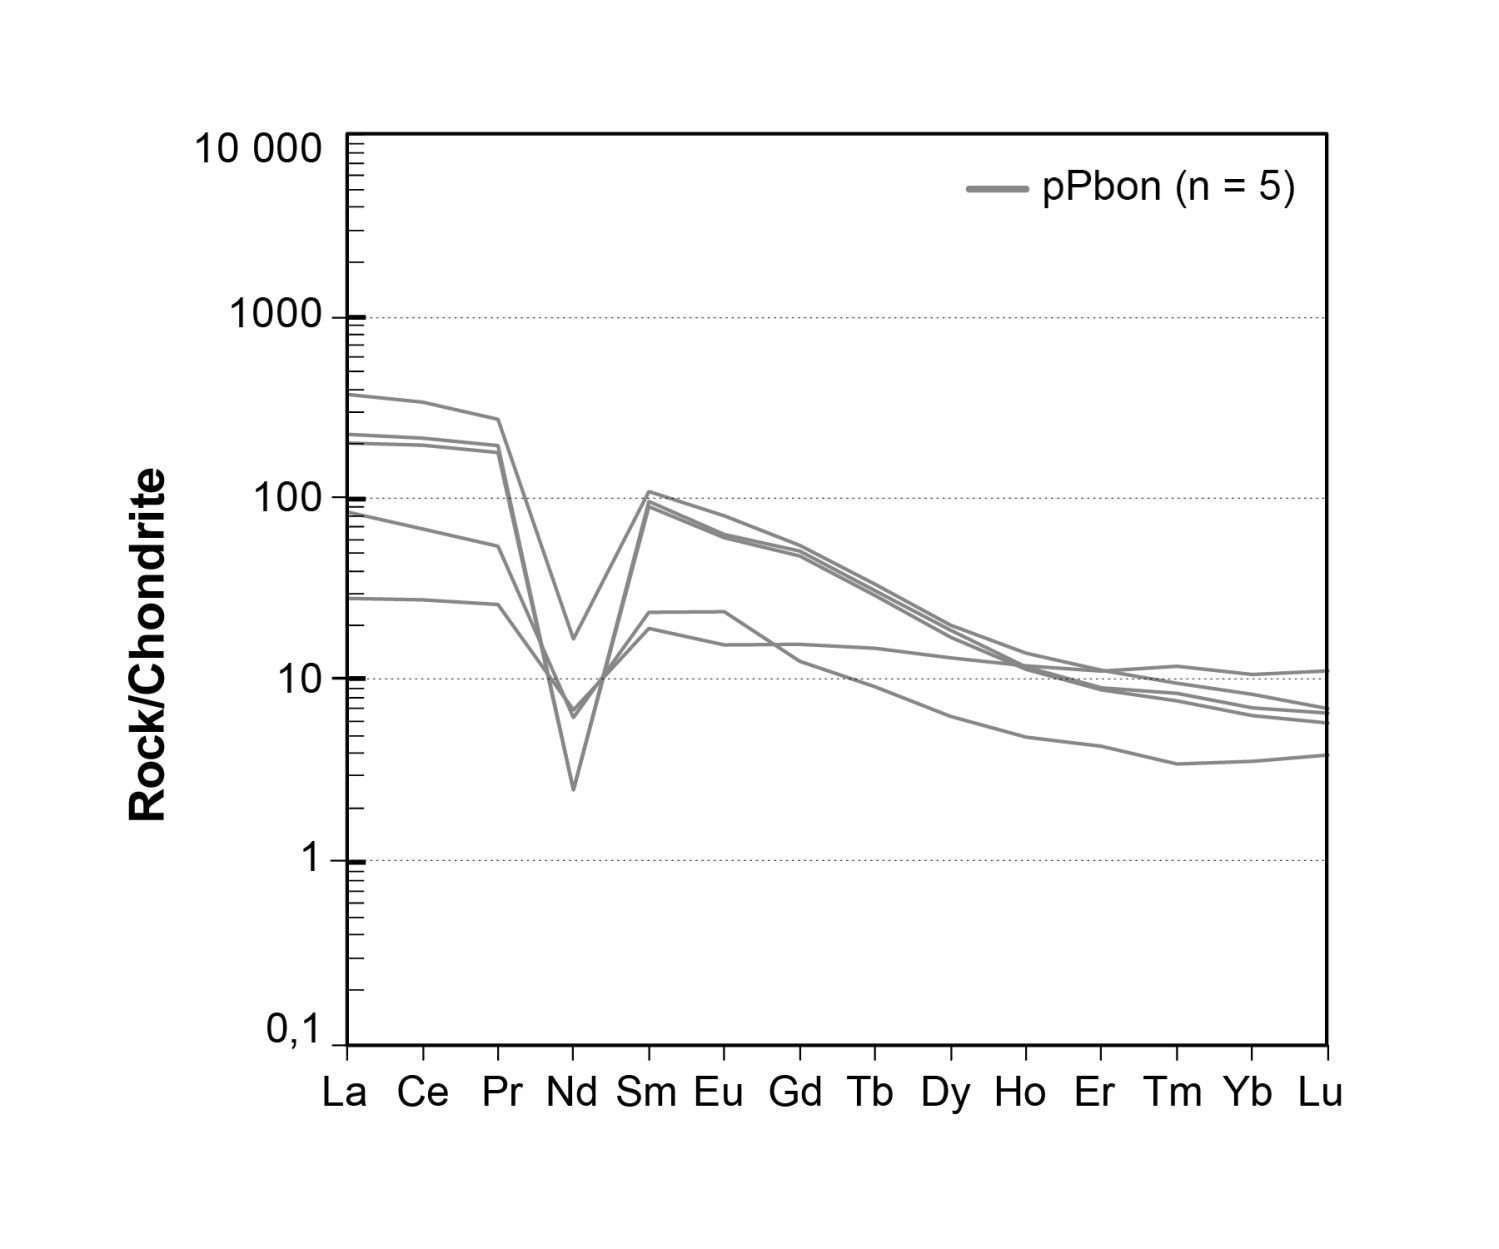
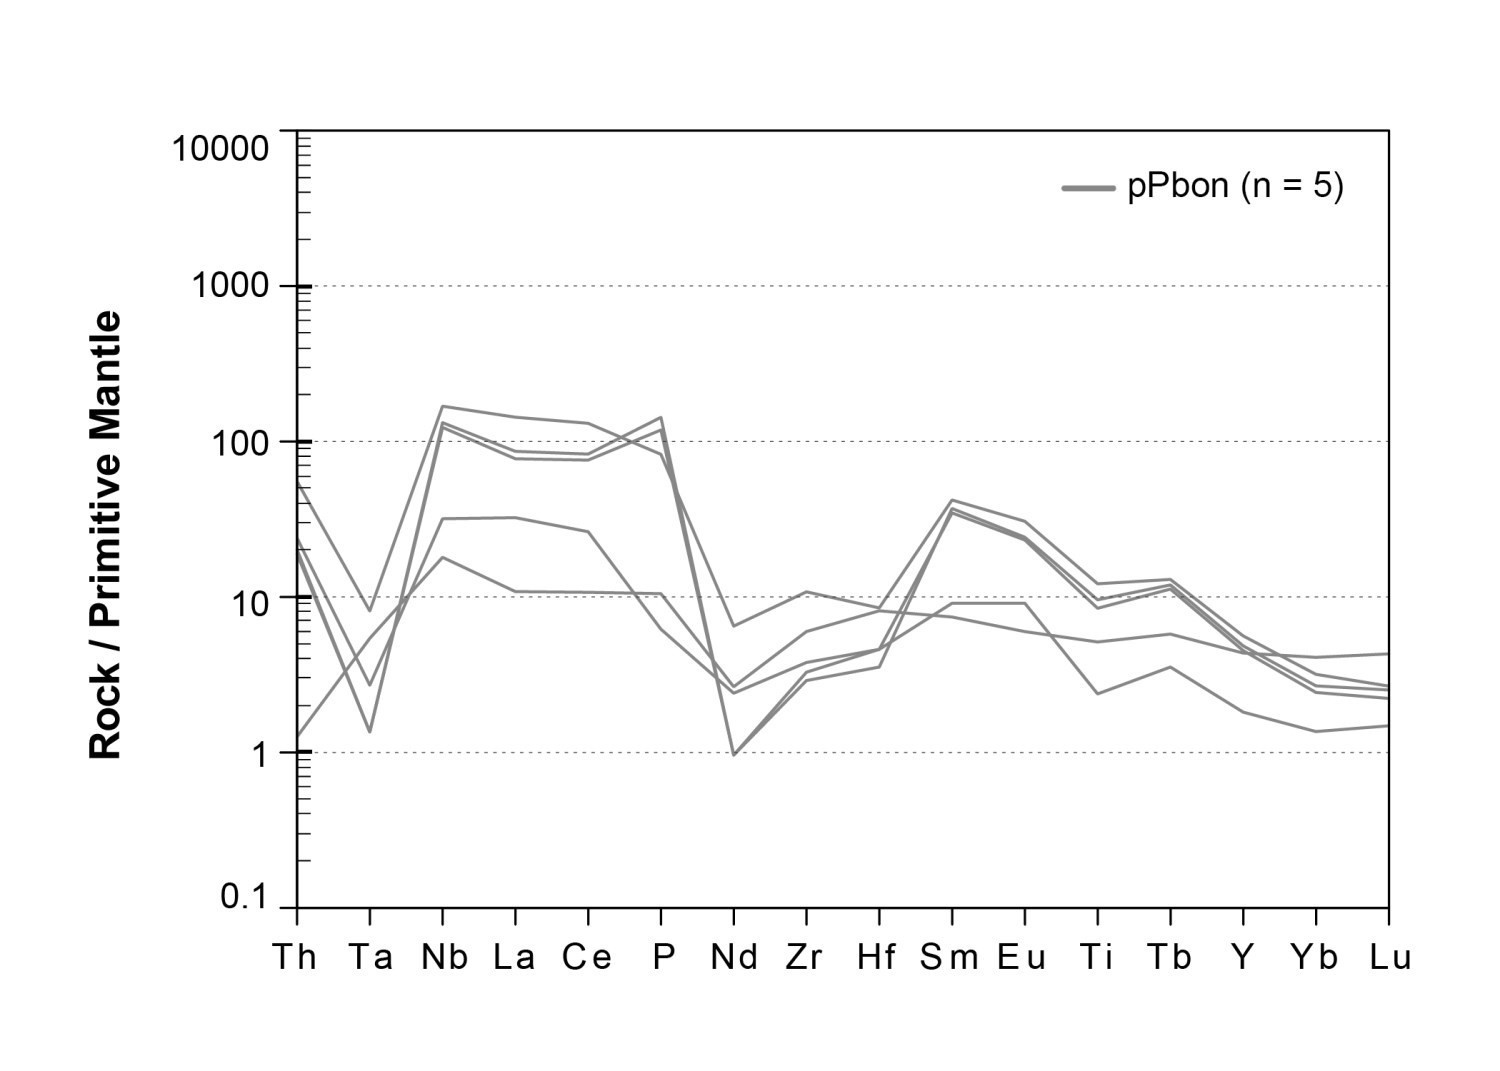
pPbon | Gabbro (Diagram) | 0.46-0.68 | 2.6 < (La/Yb)N < 44.5 1.5 < (La/Sm)N < 3.6 1.5 < (Gd/Yb)N < 7.5 0.9 < Eu/Eu* < 1.4 (Diagram) | Negative anomalies in: Ta, Nd, Zr‑Hf, Ti Positive anomalies in: (Th), Nb, P (Diagram) | |||
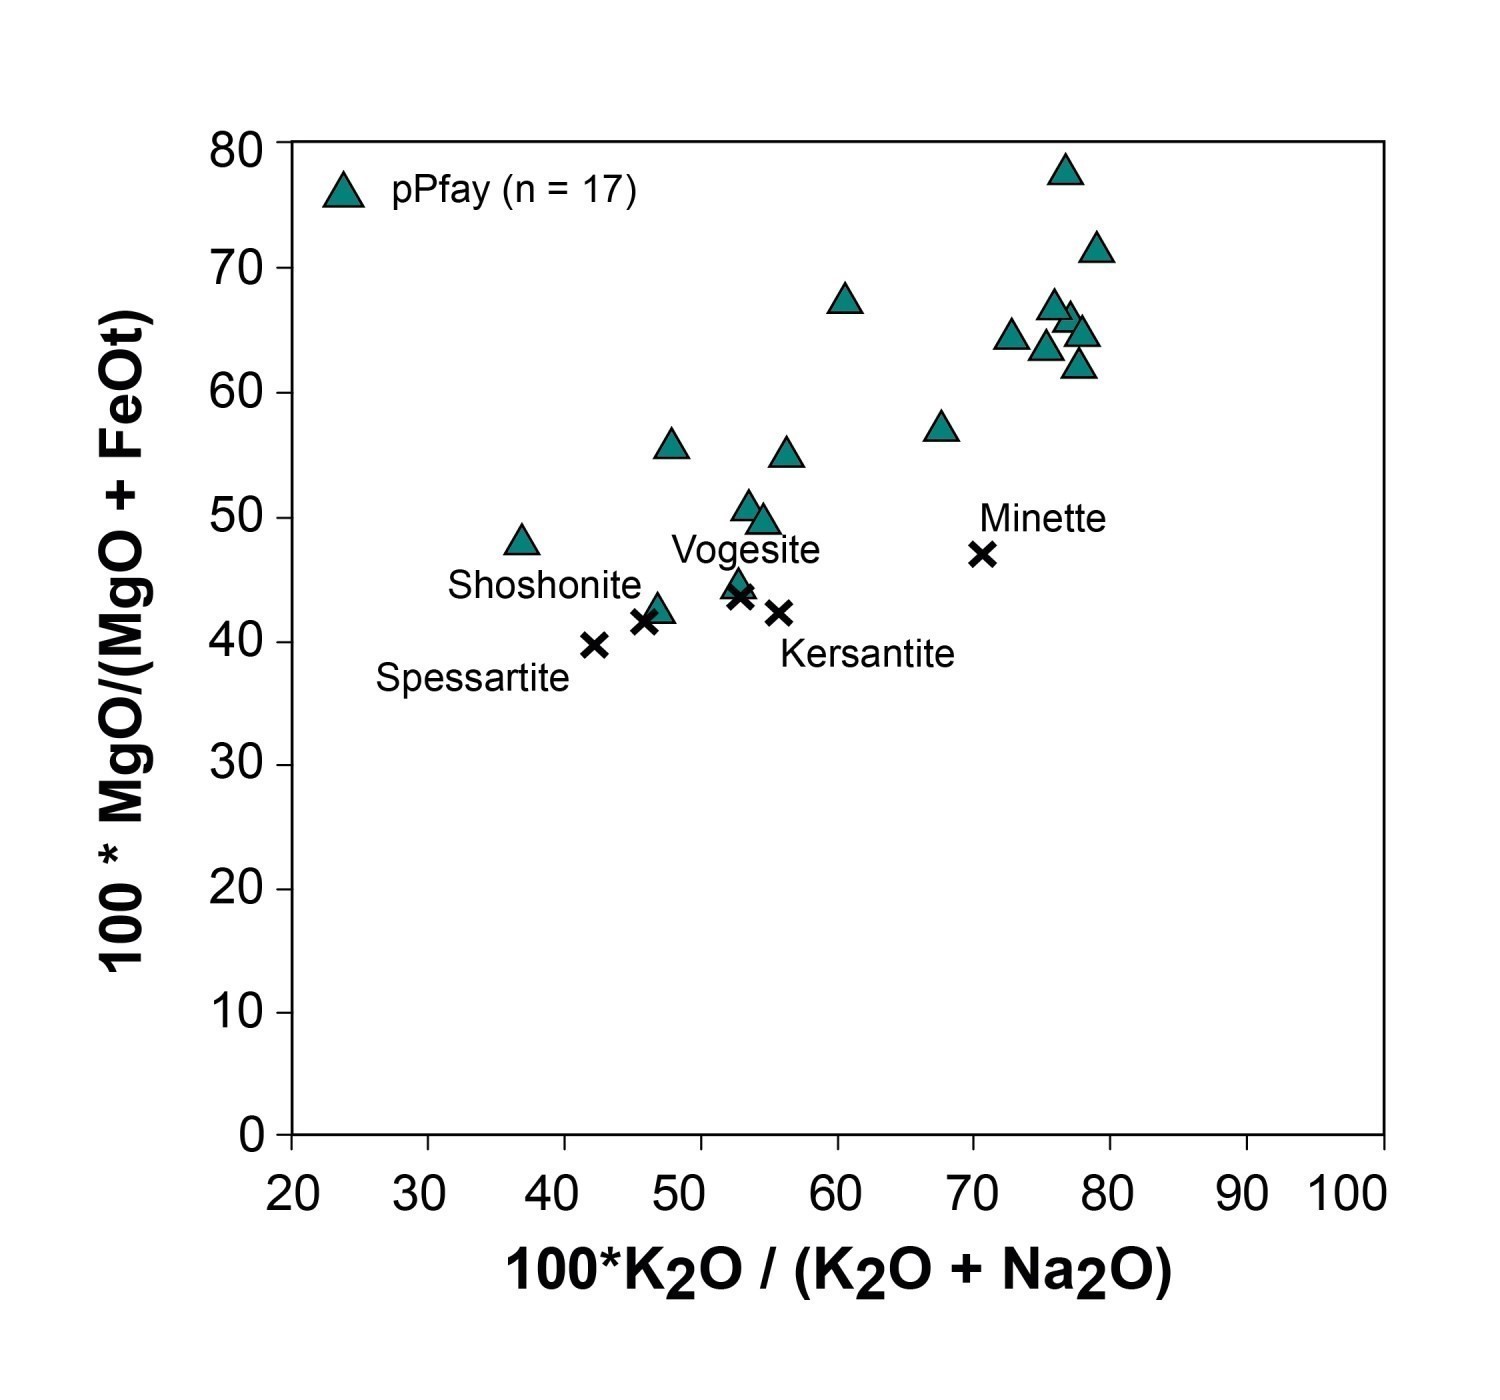
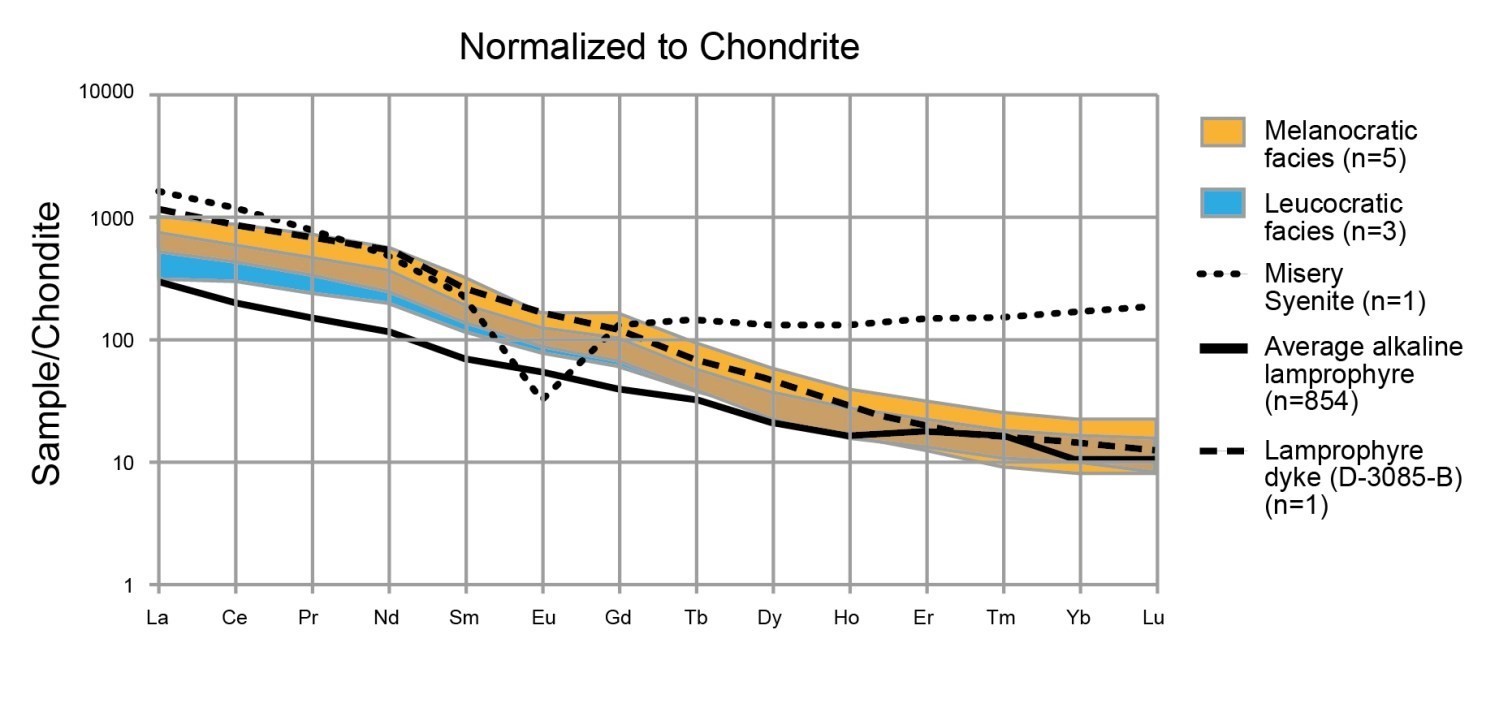
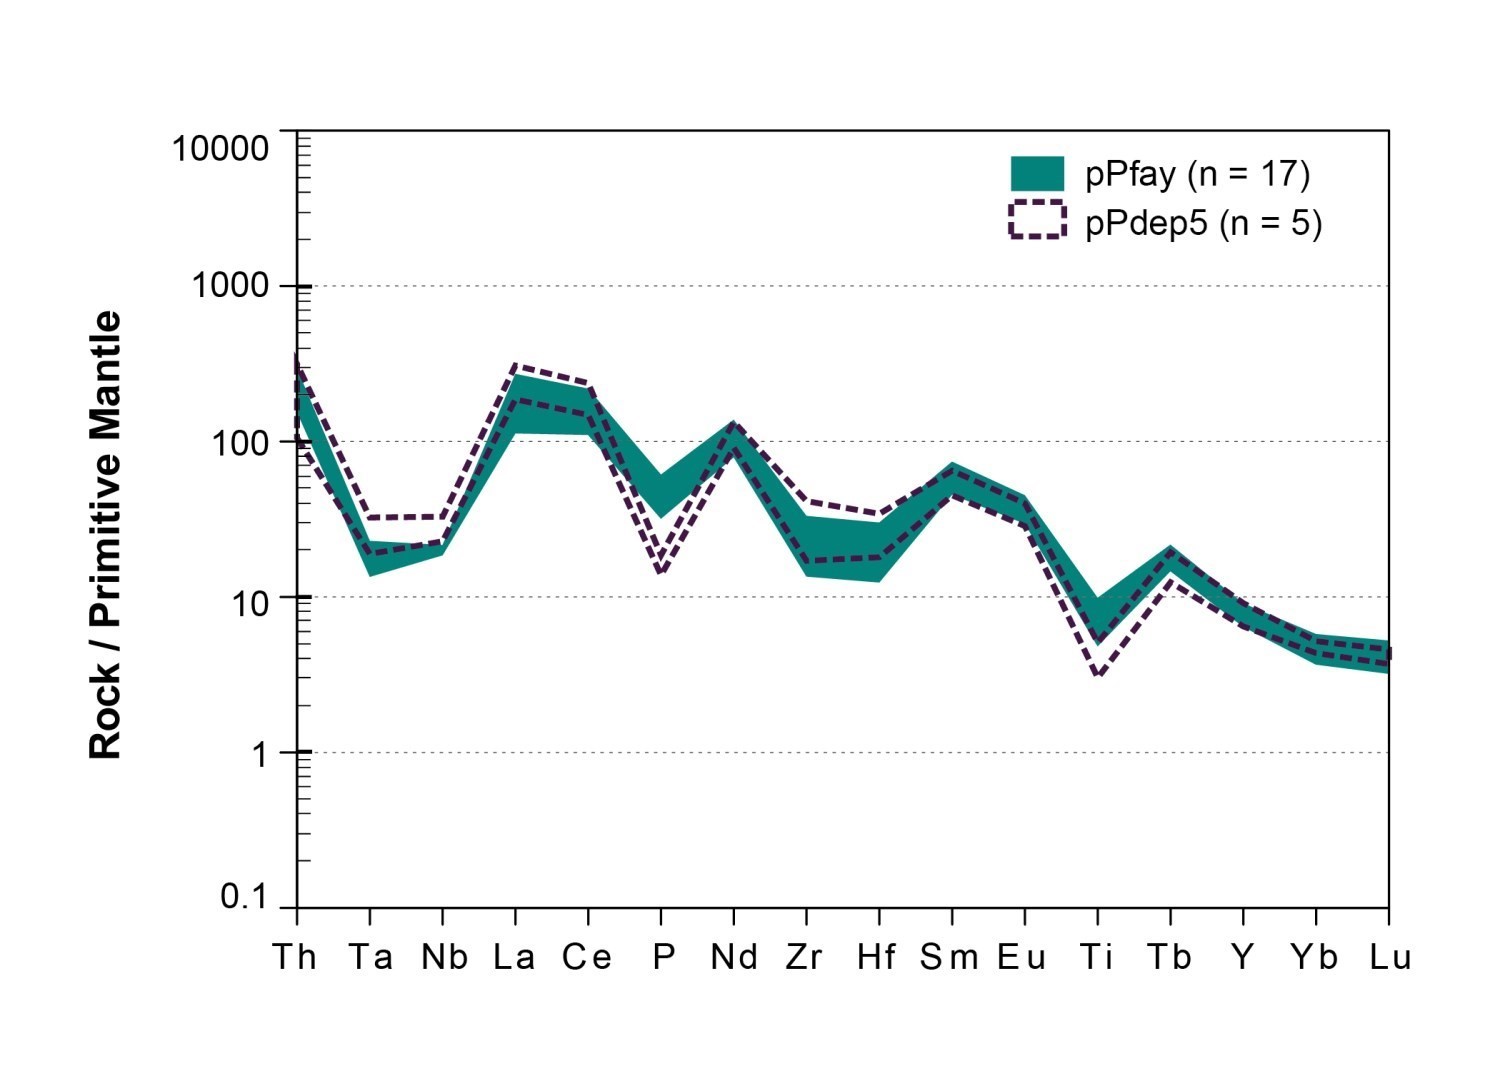
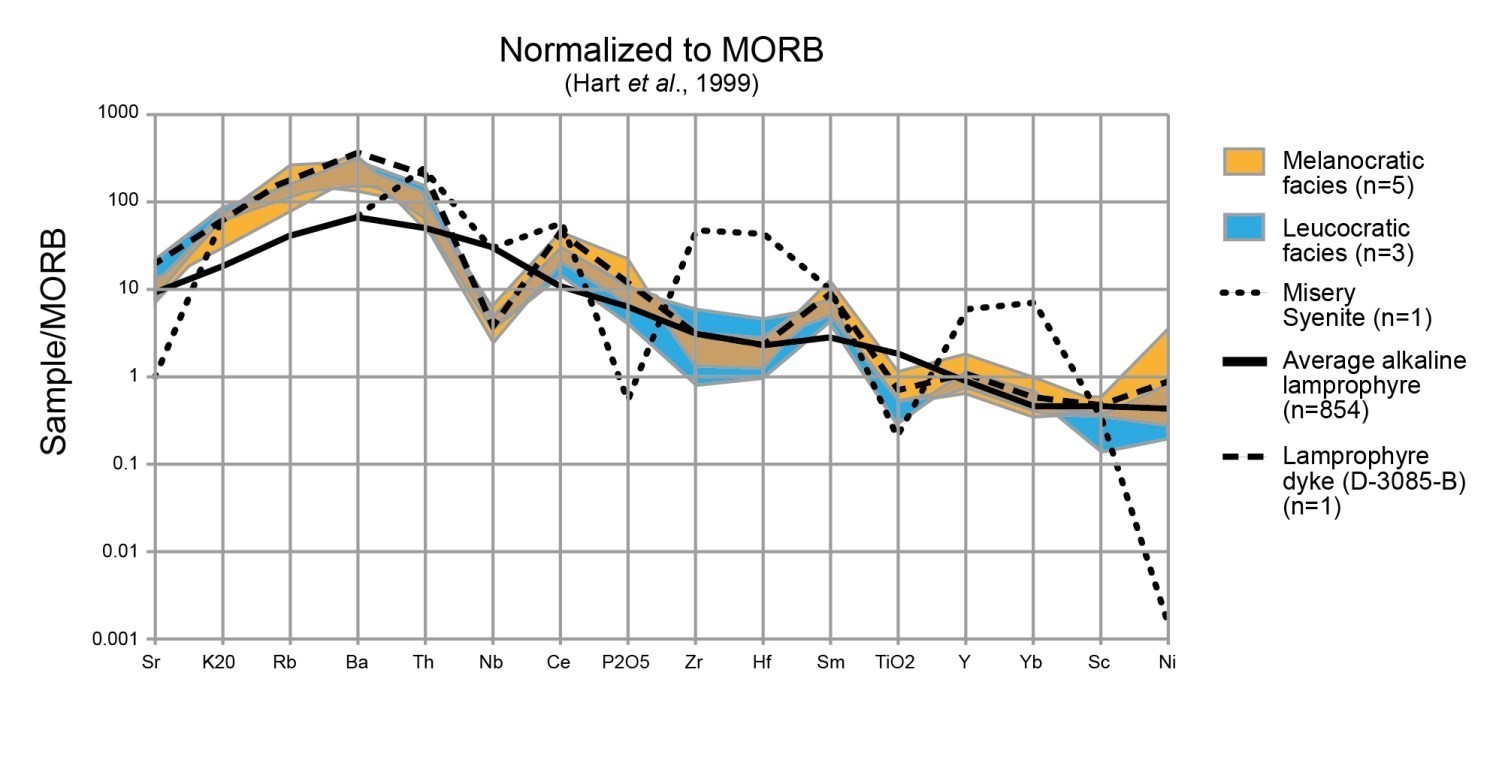
pPfay | Lamprophyres (vogesite, minette mélanocrate) (Diagram) | 0.42-0.78 | 30.3 < (La/Yb)N < 46.6 2.5 < (La/Sm)N < 3.7 6.2 < (Gd/Yb)N < 6.7 Eu/Eu* ≈ 0.9 (Diagram) Light REE enrichment compared to the average alkaline lamprophyre of Rock (1991) (Diagram) | Negative anomalies in: Ta‑Nb, P, Zr‑Hf, Ti Positive anomalies in: Th (Diagram) Negative anomalies in: Nb, TiO2 Positive anomalies in: Sr, K2O, Rb, Ce, Ba, Sm (Diagram) | REE and spider diagrams similar to those of unit pPdep5 and comparable to that of an average alkaline lamprophyre | ||
The De Pas Supersuite consists of a granitic suite (pPdep) and a charnockitic suite (pPcde). These suites also include the Merville (pPmer) and Bonaventure (pPbon) plutons, respectively. Trace elements of granitoid samples of the De Pas Supersuite suggest a volcanic arc setting, as proposed by Martelain et al. (1998). All granitoids in the supersuite are Type I and generally have affinities ranging from calc-alkaline to alkaline-calcic. With the exception of the pPdep4 granite unit of the De Pas Granitic Suite, which includes magnesian and ferroan granites, De Pas granitoids are generally magnesian. A feature observed in the De Pas Charnockitic Suite samples is the Nd and Sm disturbance on RRE diagrams and, in places, decoupling of the Ta-Nb anomaly is observed on the 25th and 75th percentile envelopes of spider diagrams. In addition, lower Th and Nb contents are observed for the charnockitic suite compared to the granitic suite. Martelain et al. (1998) explain the weak contents of large-ion lithophile elements (LILE) of the De Pas Charnockitic Suite by the primary character of granulitic magmas, as well as by the differential contamination of each suite according to host terrains (the charnockitic suite host, limited to the south of the George Domain, includes granulitic gneiss immediately to the west). Spider diagrams of Fayot Suite (pPfay) samples are similar to syenites of De Pas Granitic Suite (pPdep5); however, P and Ti anomalies are more significant. The Fayot Suite sample profiles are comparable to that of an average alkaline lamprophyre (Rock, 1991), except that the Fayot Suite shows enrichment in light REE, Sr, K2O, Rb, Ce, Ba and Sm, and depletion in Nb and TiO2 (Chartier, 2015).
References
Publications Available Trough SIGEOM Examine
MARTELAIN, J. 1986. RAPPORT D’ACTIVITE 1986 – DIRECTION DE LA RECHERCHE GEOLOGIQUE. MER. DV 86-14, 93 pages.
Other Publications
CHARTIER, M.O., 2015. Caractérisation pétrographique et géochimique des roches alcalines de la Suite de Fayot, Province de Churchill. Université du Québec à Chicoutimi; projet de fin d’études, 51 pages.
DEBON, F., LEFORT, P., 1983. A chemical-mineralogical classification of common plutonic rocks and associations. Transactions of the Royal Society of Edinburgh, Earth Sciences; volume 73, pages 135–149. doi.org/10.1017/S0263593300010117.
DE LA ROCHE, H., LETERRIER, J., GRANDCLAUDE, P., MARCHAL, M., 1980. A classification of volcanic and plutonic rocks using R1-R2 diagrams and major element analyses – its relationships with current nomenclature. Chemical Geology; volume 29, pages 183–210. doi.org/10.1016/0009-2541(80)90020-0.
FROST, B.R., BARNES, C.G., COLLINS, W.J., ARCULUS, R.J., ELLIS, D.J., Frost, C.D., 2001. A geochemical classification for granitic rocks. Journal of Petrology; volume 12, pages 2033–2048. doi.org/10.1093/petrology/42.11.2033.
HARRIS, N.B.W., PEARCE, J.A., TINDLE, A.G., 1986. Geochemical characteristics of collision-zone magmatism. In: Collision tectonics (Coward, M.P. and Reis, A.C., editors). Geological Society, London; Special Publications, volume 19, pages 67–81, doi.org/10.1144/GSL.SP.1986.019.01.04.
HART, S.R., BLUSZTAJN, J., DICK, H.J.B., MEYER, P.S., MUEHLENBACHS, K.,1999. The fingerprint of seawater circulation in a 500-meter section of ocean crust gabbros. Geochimica et Cosmochimica Acta; volume 63, pages 4059–4080. doi.org/10.1016/S0016-7037(99)00309-9.
HASTIE, A.R., KERR, A.C., PEARCE, J.A., MITCHELL, S.F., 2007. Classification of altered volcanic island arc rocks using immobile trace elements: development of the Th-Co discrimination diagram. Journal of Petrology; volume 48, pages 2341–2357. doi.org/10.1093/petrology/egm062.
MCDONOUGH, W.F., SUN, S.S., 1995. The composition of the earth. Chemical Geology; volume 120, pages 223–253. doi.org/10.1016/0009-2541(94)00140-4.
MCLENNAN, S.M., HEMMING, S.R., MCDANIEL, D.K., HANSON G.N., 1993. Geochemical approaches to sedimentation, provenance, and tectonics. Geological Society of America; Special Paper, volume 284, pages 21–40. doi.org/10.1130/SPE284-p21.
MIDDLEMOST, E.A.K.,1985. Magmas and Magmatic Rocks. An Introduction to Igneous Petrology. Longman, London. 266 pages.
NESBITT, H.W., 2003. Petrogenesis of siliciclastic sediments and sedimentary rocks. In: Geochemistry of Sediments and Sedimentary Rocks: Evolutionary Consideration to Mineral Deposit-Forming Environments. (Lentz, D.R., editor). Geological Association of Canada; volume 4, pages 39–51.
PALME, H., O’NEILL, H.S.C., 2004. Cosmochemical estimates of mantle composition. In: Treatise on Geochemistry. (Holland, H.D. and Turrekian, K.K. editors), Elsevier, Amsterdam, The Netherlands; volume 2, pages 1–38. doi.org/10.1016/B978-0-08-095975-7.00201-1.
PEARCE, J.A., GALE, G.H., 1977. Identification of ore-deposition environment from trace element gechemistry of associated igneous host rocks. Geological Society, London; Special Publications, Volume 7, pages 14–24. doi.org/10.1144/GSL.SP.1977.007.01.03.
PEARCE, J.A., HARRIS, B.W., TINDLE, A.G., 1984. Trace element discrimination diagram for tectonic interpretation of granitic rocks. Journal of Petrology; volume 25, pages 956–983. doi.org/10.1093/petrology/25.4.956.
PETTIJOHN, F.J., POTTER, P.E., SIEVER, R., 1972. Sand and Sandstones. Springer-Verlag, New York, 618 pages.
ROCK, N.M.S., 1991. Lamprophyres. Blackie and Son Ltd., London, 294 pages.
ROSS, P.S., BÉDARD, J.H., 2009. Magmatic affinity of modern and ancient subalkaline volcanic rocks determined from trace-element discriminant diagrams. Canadian Journal of Earth Science; volume 46, pages 823–839. doi.org/10.1139/E09-054.
WINCHESTER, J.A., FLOYD, P.A., 1977. Geochemical discrimination of different magma series and their differentiation products using immobile elements. Chemical Geology; volume 20, pages 325–343. doi.org/10.1016/0009-2541(77)90057-2.
WOOD, D.A., 1980. The application of a Th–Hf–Ta diagram to problems of tectonomagmatic classification and to establishing the nature of crustal contamination of basaltic lavas of the British Tertiary volcanic province. Earth and Planetary Science Letters; volume 50, pages 11–30. doi.org/10.1016/0012-821X(80)90116-8.